Grafana is a free and opensource tool for querying, analyzing and visualizing metrics from an array of multiple data sources whether physical or from the cloud. With Grafana, you can create, explore and share beautiful and intuitive dashboards from different data sources without a hassle. Some of the data sources it connects with include MySQL server, Graphite, PostgreSQL, InfluxDB, Elasticsearch, and Prometheus. In this guide, we will demonstrate how you can integrate Prometheus with Grafana. But first, we are going to Install Grafana. Check out our previous topic to see how you can install Prometheus on CentOS 8.
Installing Grafana on CentOS 8 / RHEL 8
We are going to install Grafana from the YUM/ DNF repository as it is much easier compared to downloading and running the .rpm package.
Step 1) Enable the DNF (or Yum) repository for Grafana
To begin with, add Grafana’s yum repository by creating a repository file as shown as root user
[root@grafana ~]# vi /etc/yum.repos.d/grafana.repo
[grafana]
name=grafana
baseurl=https://packages.grafana.com/oss/rpm
repo_gpgcheck=1
enabled=1
gpgcheck=1
gpgkey=https://packages.grafana.com/gpg.key
sslverify=1
sslcacert=/etc/pki/tls/certs/ca-bundle.crt
save and exit the file
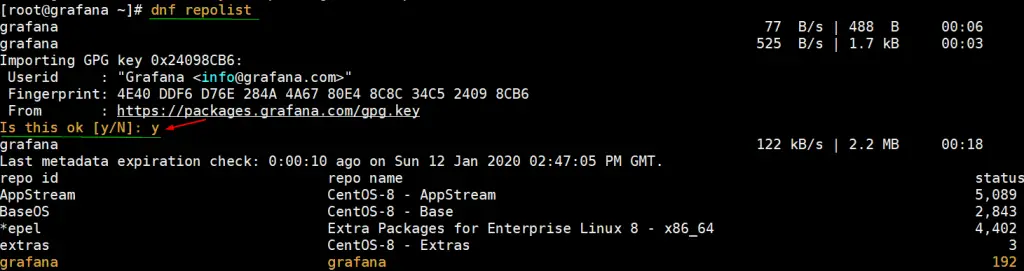
Run below dnf command to view all enabled package repositories, in the output we should see Grafana repository too.
[root@grafana ~]# dnf repolist
Step 2) Install Grafana Monitoring tool
To install Grafana, use the DNF package manager as follows:
[root@grafana ~]# dnf install grafana -y
You can verify that Grafana is installed using the rpm command as shown
[root@grafana ~]# rpm -qa | grep grafana
grafana-6.5.2-1.x86_64
[root@grafana ~]#
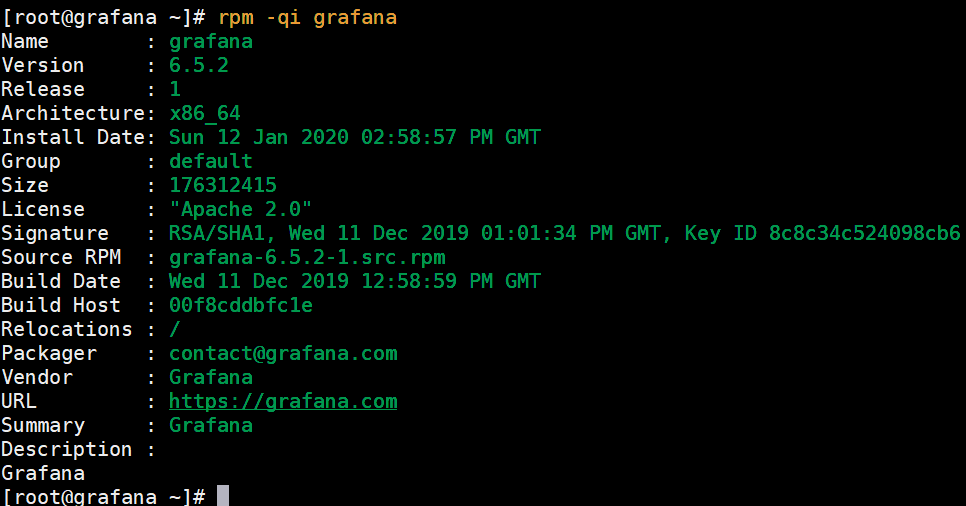
To gather more information about Grafana such as the version, architecture and license, run the command:
[root@grafana ~]# rpm -qi grafana
Step 3) Start and enable Grafana service
With Grafana successfully installed, we need to start the Grafana service and ensure it is running. So to start Grafana, run the command:
[root@grafana ~]# systemctl daemon-reload
[root@grafana ~]# systemctl start grafana-server
To enable Grafana on boot run:
[root@grafana ~]# systemctl enable grafana-server
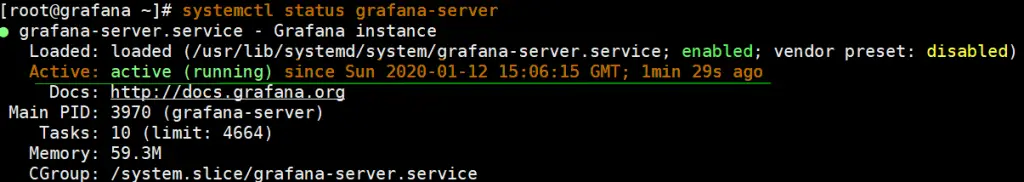
You can verify that Grafana is running by executing the command:
[root@grafana ~]# systemctl status grafana-server
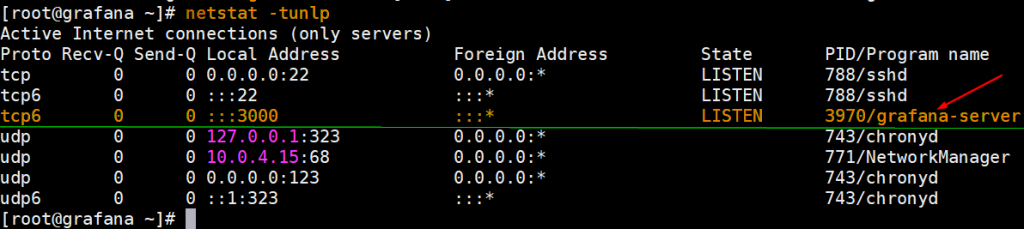
Additionally, you can use the netstat command to verify if Grafana is listening on its default port, which is port 3000.
Step 4) Open the port for Grafana in the Firewall
If you have a firewall running on your system, you need to allow port 3000 for external users to access Grafana on the browser. To open port 3000, execute the command:
[root@grafana ~]# firewall-cmd --add-port=3000/tcp --permanent
success
[root@grafana ~]#
Then reload the firewall to effect the changes
[root@grafana ~]# firewall-cmd --reload
success
[root@grafana ~]#
Step 5) Accessing Grafana
With all the configuration done, head over to your browser and visit your Grafana server’s URL as shown: http://server-ip:3000/
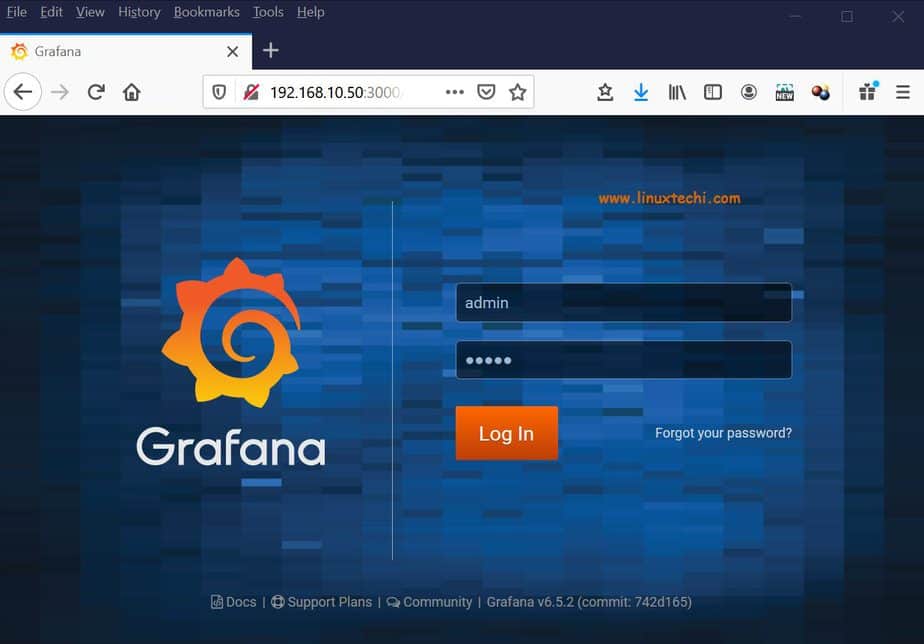
Login using the default credentials as shown:
- Username: admin
- Password: admin
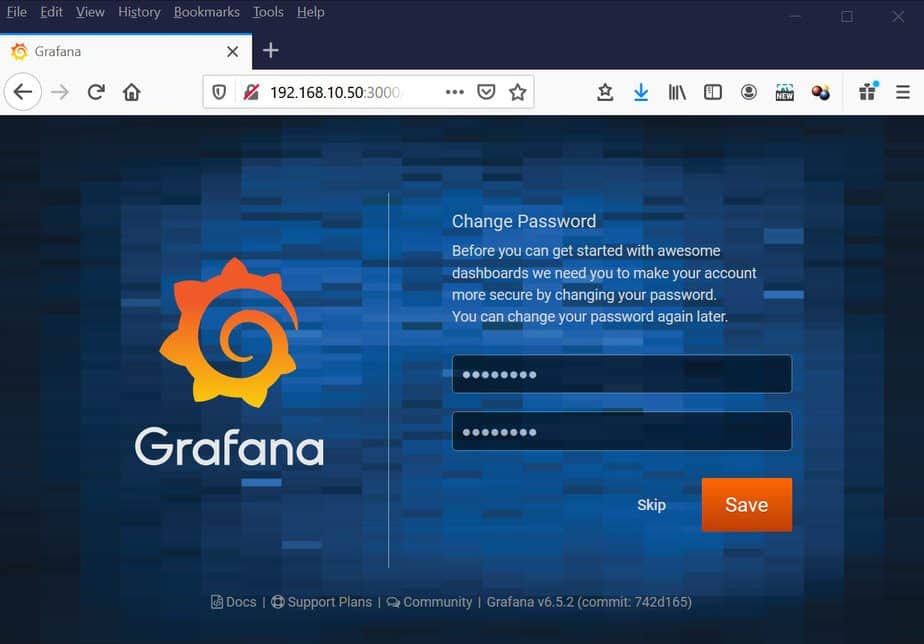
Grafana will then prompt you to set a strong password for obvious reasons. Type the new password and confirm it and finally click on the ‘Save’ button to save the changes made to your password.
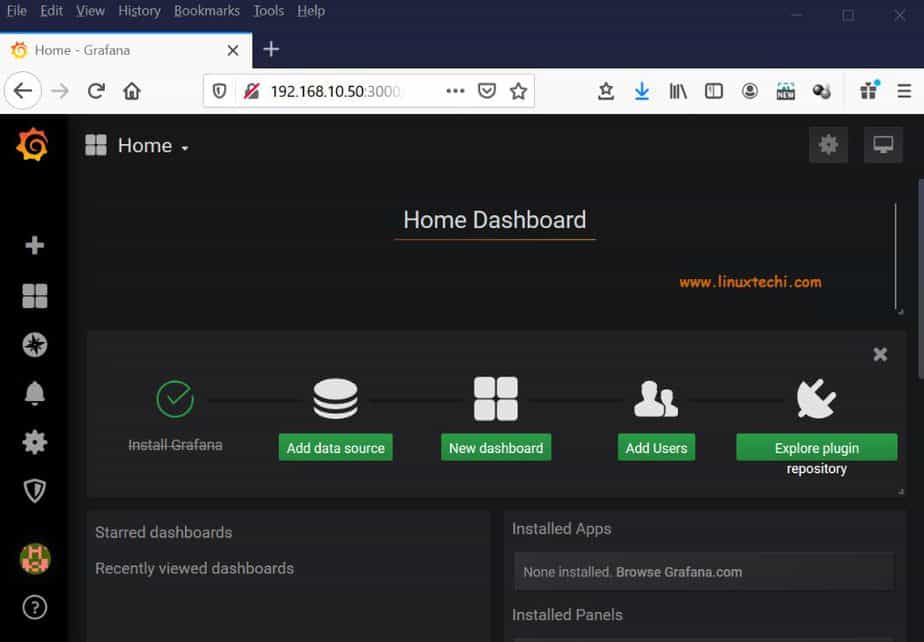
This ushers you to Grafana’s dashboard.
We have successfully installed the Grafana monitoring server. Now it’s time to switch gears and integrate Grafana with the Prometheus server which we installed in our last topic.
Integrate Grafana with Prometheus for Monitoring
While Prometheus can display accurate system metrics, Grafana is the better of the two giving you intuitive and visually appealing dashboards that display a wide array of metrics as you will see. Additionally, you can customize, query and save the dashboards and even share them with other users.
In this section, we demonstrate how you can integrate Prometheus with Grafana. On the dashboard, click on the ‘Add data source’ option
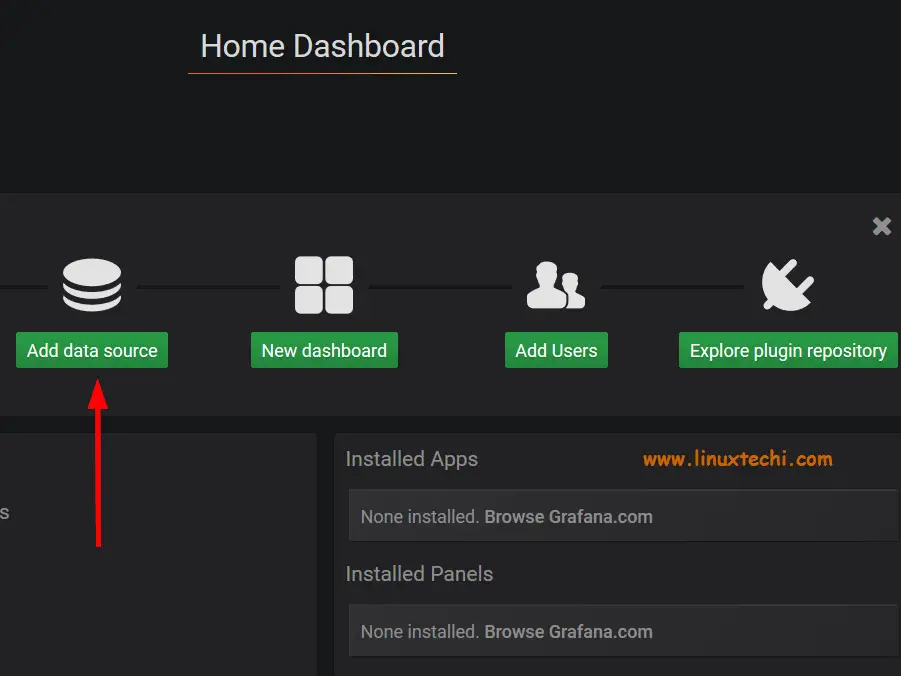
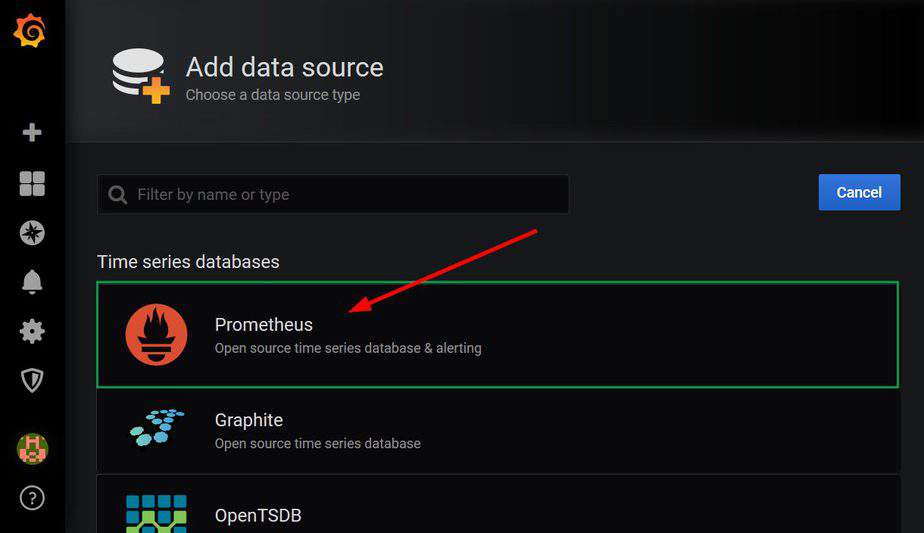
A list of data sources will be displayed that you can integrate with. Because we are interested in Prometheus integration, simply click on the ‘Prometheus’ option
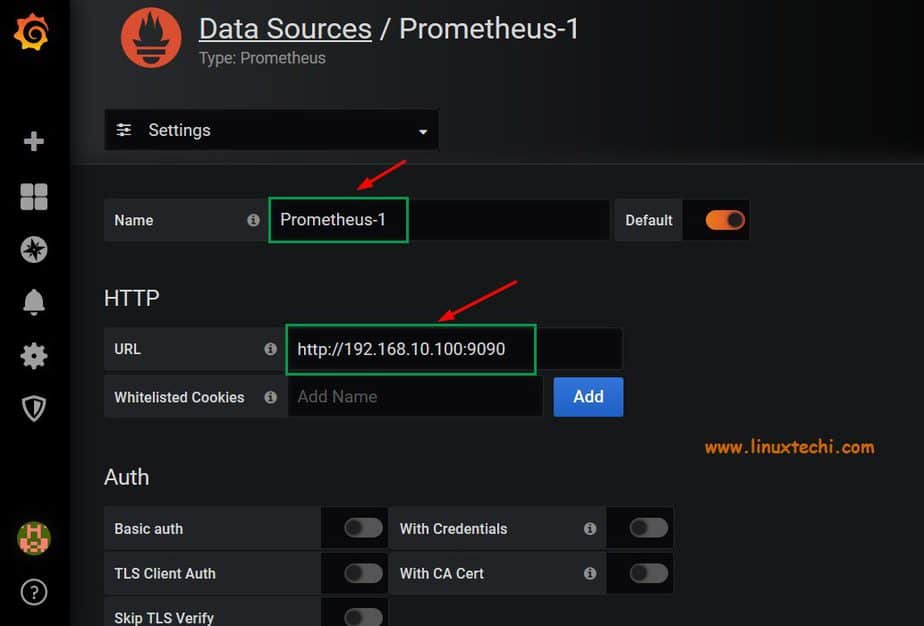
Type the Prometheus server address in the URL text field
http://prometheus-server-ip:9090/
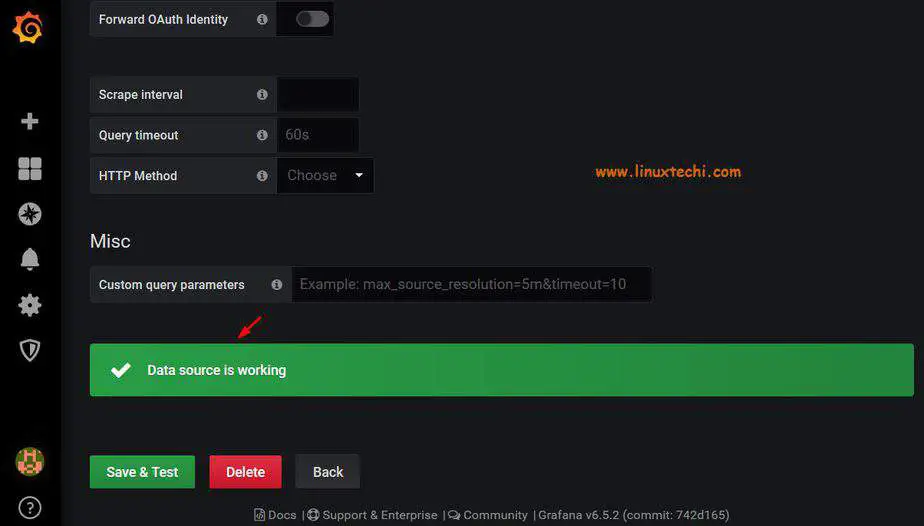
Click the ‘Save and Test’ button and you should get the output indicating ‘Data source is working’.
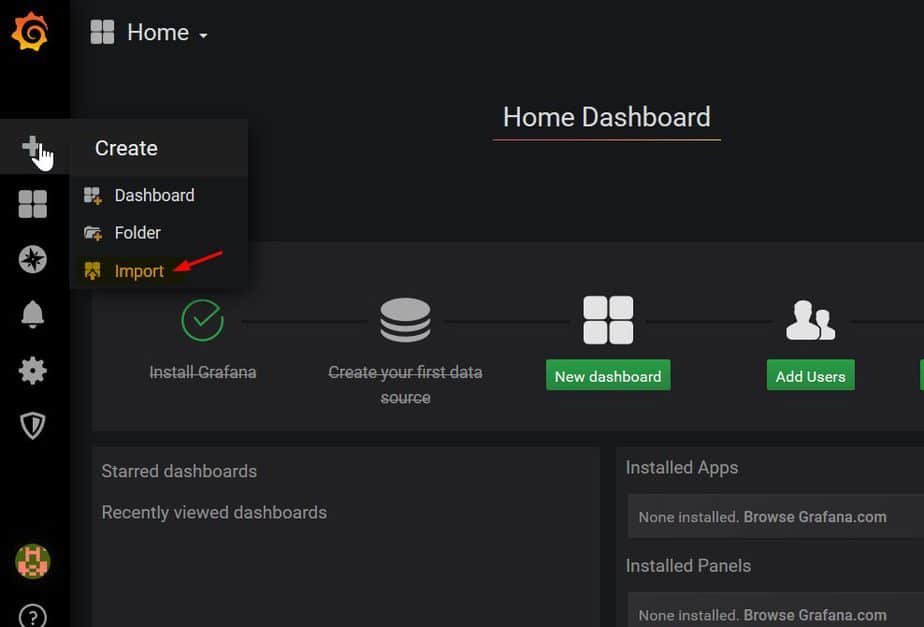
To create a dashboard for visualizing metrics, click on the plus sign on the left sidebar and click on ‘import’
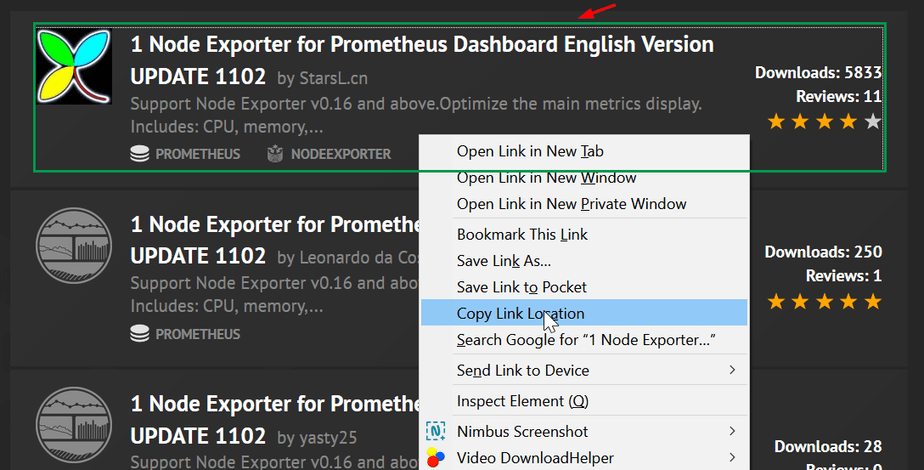
You will be required to fill out the URL of a dashboard from Grafana’s repository. So, head out to Grafana’s official dashboards page and right-click on a node_exporter dashboard ( I have selected the first one because of its good reviews and many downloads) and copy its link.
Paste the link in the URL section
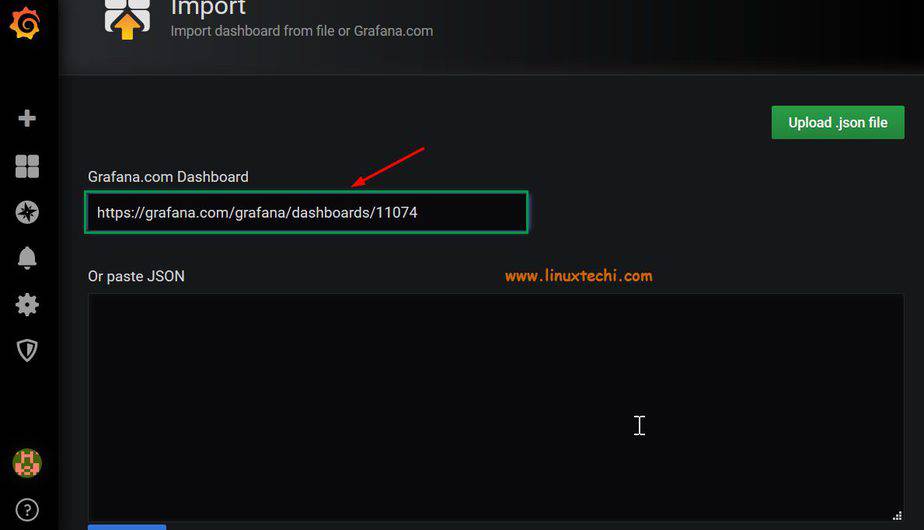
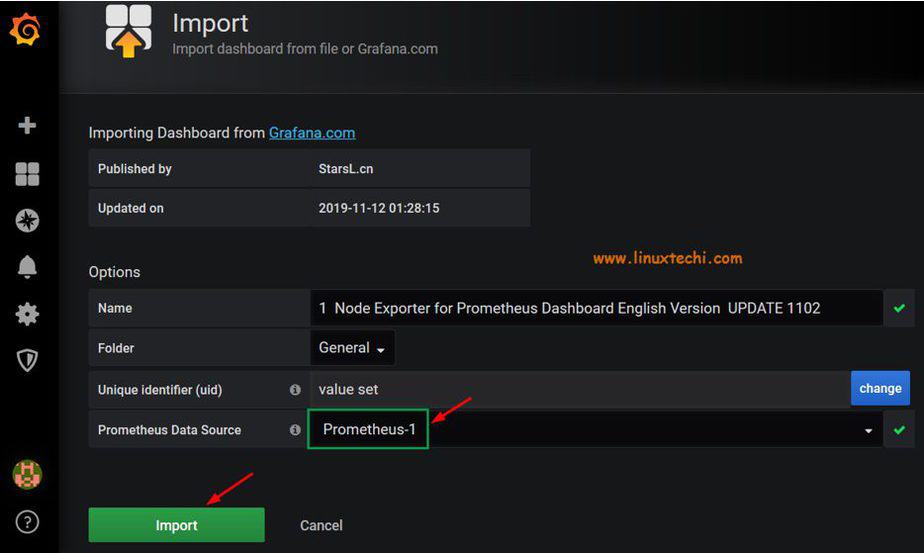
Once you paste the link, wait a few seconds and the data below will be generated. Change the Prometheus Data Source Name as “Prometheus-1” and then Click on ‘Import’
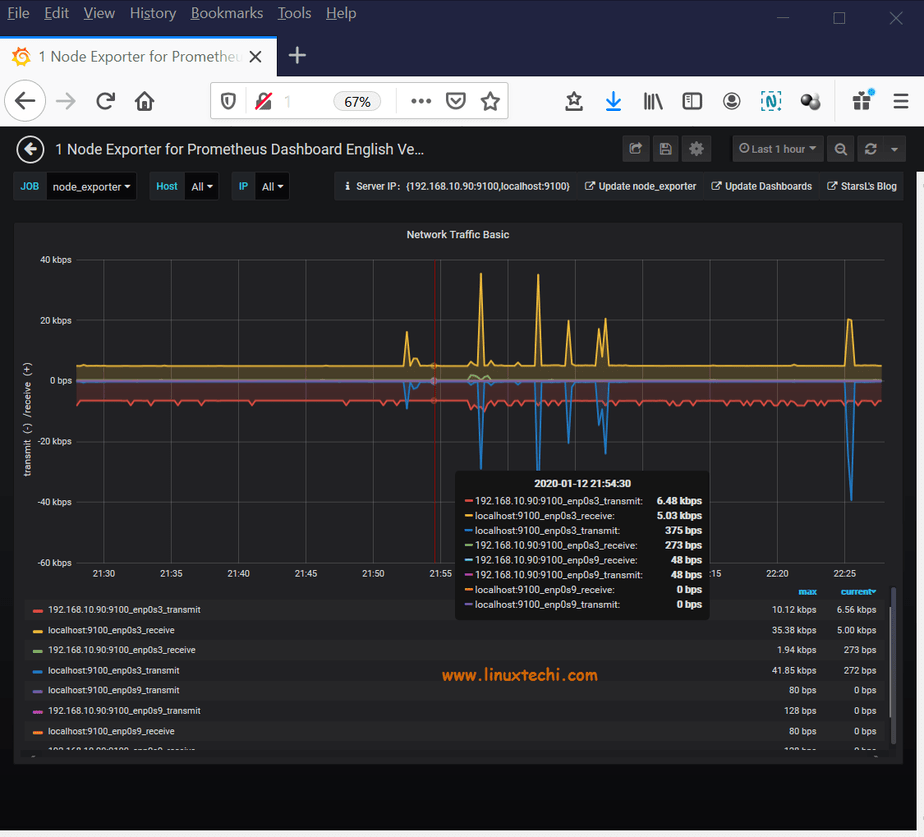
Grafana will begin fetching the metrics from the Prometheus server and visualize then in colorful and intuitive dashboards.
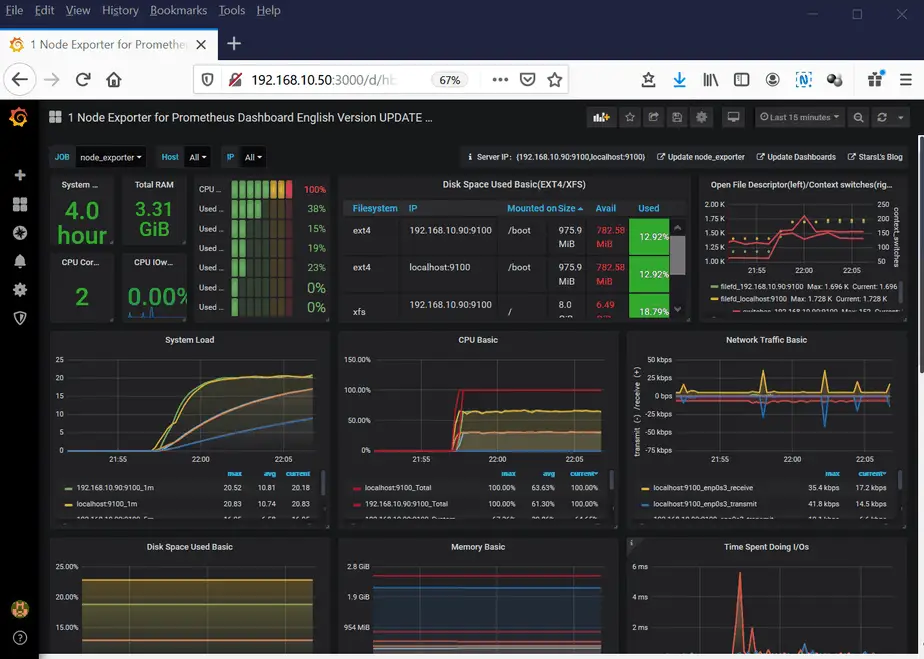
You can select a dashboard for a specific component and view it on full screen mode.
This wraps up our tutorial today, We hope you can now integrate Prometheus and Grafana and enjoy stunning and beautiful visualizations.

Superb post…Made my life much easier
Hi James,
Thanks for the guide, I was able to configure without any issue.
One request, can you please share the link for AlertManager via gmail.
Geeks always geek. many thanks. Respect!!