Prometheus is an open source monitoring, querying and alerting tool. Originally built by Soundcloud in 2012, the feature-rich tool has been adopted by several companies to monitor their IT infrastructure and ensure all systems are running smoothly. Prometheus allows you to query and pull time-series metrics such as CPU & memory utilization over HTTP protocol and visualize them on real-time graphs. You can also configure Prometheus to push alerts in the event of a node or service downtime and integrate it with other third-party monitoring tools such as Grafana for enhanced data visualization. In this guide, we will look at the installation of Prometheus on the CentOS 8 /RHEL 8 system.
Step1) Creating a Prometheus user and group
To start off, we are going to create a system user for Prometheus. Execute the command below to achieve this.
[root@prometheus ~]# useradd -m -s /bin/false prometheus
[root@prometheus ~]# id prometheus
uid=1002(prometheus) gid=1002(prometheus) groups=1002(prometheus)
[root@prometheus ~]#
As you may have noted, the system user has no login permissions as specified in the /bin/false option
Step 2) Creating configuration directories for Prometheus
Once the user for Prometheus has been created, we are then going to create configuration directories in the /etc and /var directories which will store Prometheus configuration files and data. So run the commands below:
[root@prometheus ~]# mkdir /etc/prometheus
[root@prometheus ~]# mkdir /var/lib/prometheus
Set the ownership on /var/lib/prometheus
[root@prometheus ~]# chown prometheus /var/lib/prometheus/
Step 3) Downloading Prometheus tar file
With the directories in place, we can now download the Prometheus. To get the latest version, head out to the Download page to obtain the latest version for your environment. At the time of penning down this article, the latest version was v 2.14.0. Alternatively, just run the command below
[root@prometheus ~]# dnf install wget -y
[root@prometheus ~]# wget https://github.com/prometheus/prometheus/releases/download/v2.14.0/prometheus-2.14.0.linux-amd64.tar.gz -P /tmp
Once the download is complete, extract the tarball file as shown
[root@prometheus tmp]# tar -zxpvf prometheus-2.14.0.linux-amd64.tar.gz
This will leave you with a directory called prometheus-2.14.0.linux-amd64
Use tree command to view directory structure,
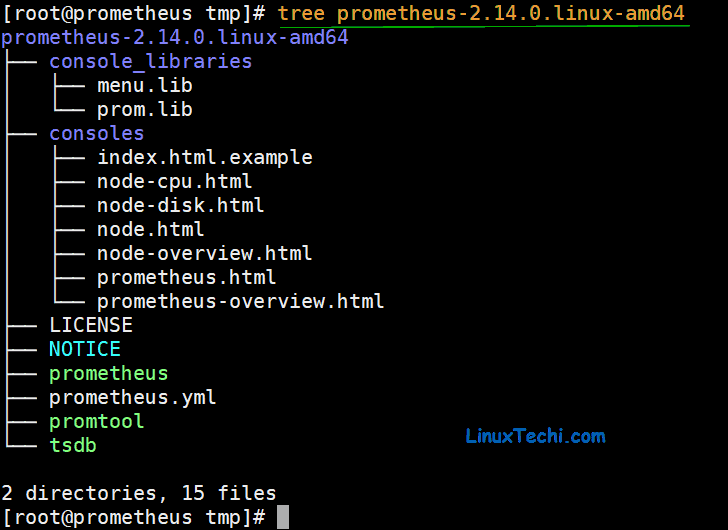
The extracted directory contains 2 binary files prometheus & promtool and that we need to copy to the /usr/local/bin path.
So, navigate to the extracted directory and copy them using the command:
[root@prometheus ~]# cd /tmp/prometheus-2.14.0.linux-amd64
[root@prometheus prometheus-2.14.0.linux-amd64]# cp prometheus  /usr/local/bin
Do likewise to the other binary file
[root@prometheus prometheus-2.14.0.linux-amd64]# cp promtool /usr/local/bin
Step 4) Creating a configuration file for Prometheus
To start off with the configuration, create a file /etc/prometheus/prometheus.yml and paste the configuration in the file
[root@prometheus ~]# vi /etc/prometheus/prometheus.yml
# Global config
global:
  scrape_interval:     15s # Set the scrape interval to every 15 seconds. Default is every 1 minute.
  evaluation_interval: 15s # Evaluate rules every 15 seconds. The default is every 1 minute.
  scrape_timeout: 15s  # scrape_timeout is set to the global default (10s).
# A scrape configuration containing exactly one endpoint to scrape:# Here it's Prometheus itself.
scrape_configs:
  # The job name is added as a label `job=<job_name>` to any timeseries scraped from this config.
  - job_name: 'prometheus'
    # metrics_path defaults to '/metrics'
    # scheme defaults to 'http'.
    static_configs:
    - targets: ['localhost:9090']
This will only monitor your local system only ( Prometheus Server).
Next, adjust the firewall as follows to allow external connections to the server via port 9090
[root@prometheus ~]# firewall-cmd --add-port=9090/tcp --permanent
success
[root@prometheus ~]# firewall-cmd --reload
success
[root@prometheus ~]#
Step 5) Creating a Systemd service file for Prometheus Server
For us to manage Prometheus as a service using systemd, we need to create a system file for it. So, create the file as shown and paste the content,
[root@prometheus ~]# vi /etc/systemd/system/prometheus.service
[Unit]
Description=Prometheus Time Series Collection and Processing Server
Wants=network-online.target
After=network-online.target

[Service]
User=prometheus
Group=prometheus
Type=simple
ExecStart=/usr/local/bin/prometheus \
    --config.file /etc/prometheus/prometheus.yml \
    --storage.tsdb.path /var/lib/prometheus/ \
    --web.console.templates=/etc/prometheus/consoles \
    --web.console.libraries=/etc/prometheus/console_libraries

[Install]
WantedBy=multi-user.target
For the changes to take effect, reload the systemctl,
[root@prometheus ~]# systemctl daemon-reload
Now start and enable Prometheus to run on boot
[root@prometheus ~]# systemctl start prometheus
[root@prometheus ~]# systemctl enable prometheus
Just to be certain that Prometheus is running, run the command:
[root@prometheus ~]# systemctl status prometheus
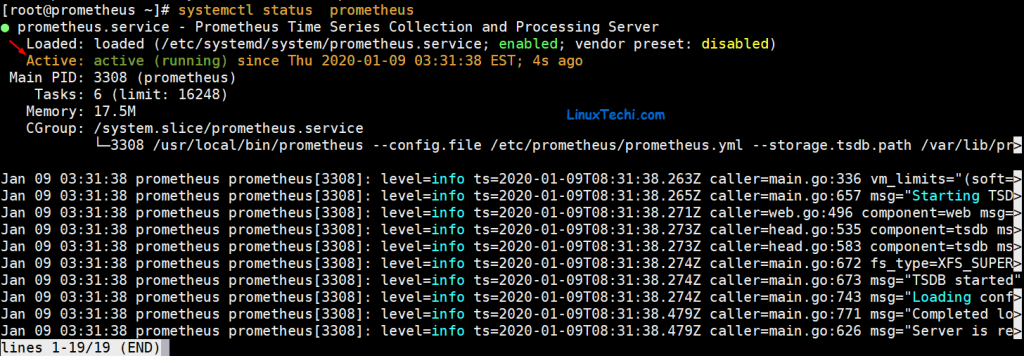
From the output displayed, we can clearly see that Prometheus is running as expected with no errors. Also, you can use the netstat utility to check is the service is listening on port 9090.
[root@prometheus ~]# netstat -tunlp
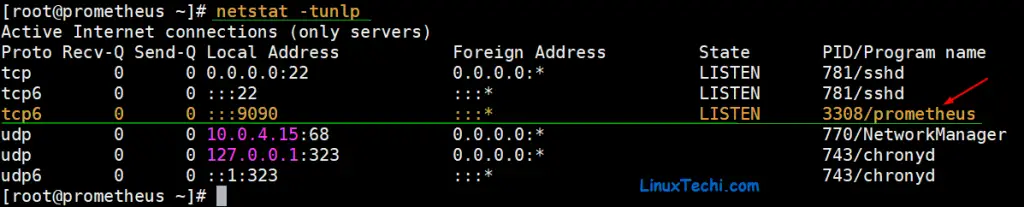
That’s great! Prometheus is running on port 9090 as expected. Now head to your browser as browse your server’s IP as shown
http://server-ip:9090
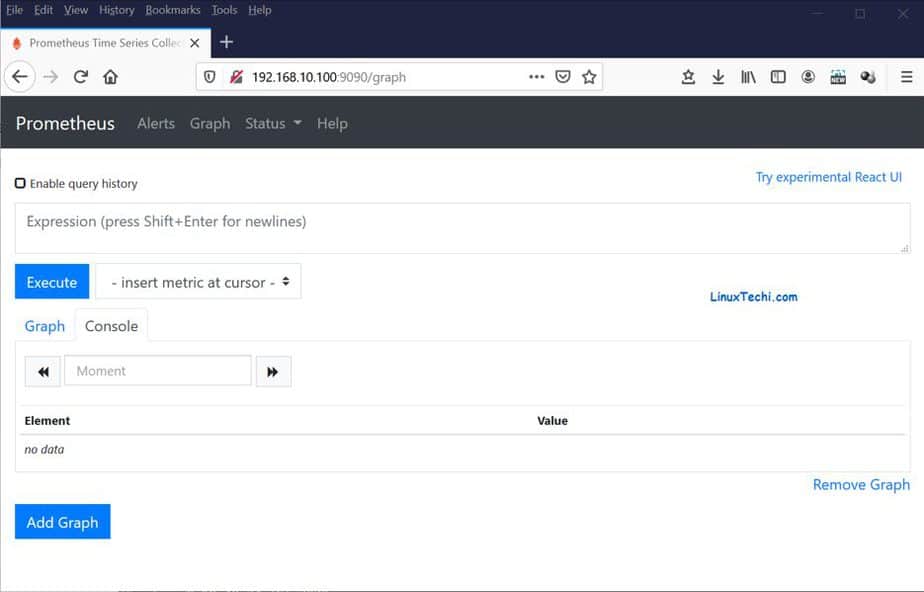
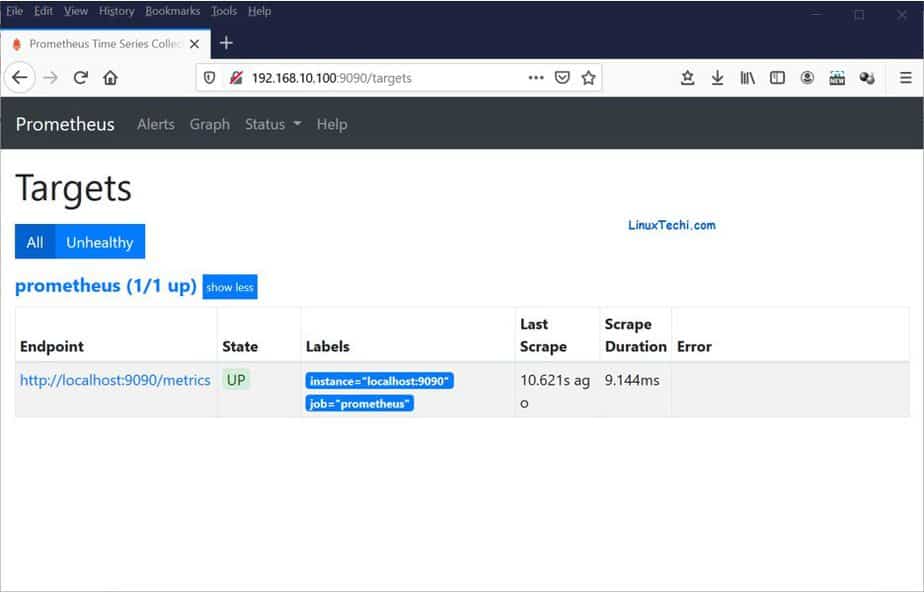
Click on the ‘Status’ tab and then click on ‘Targets’
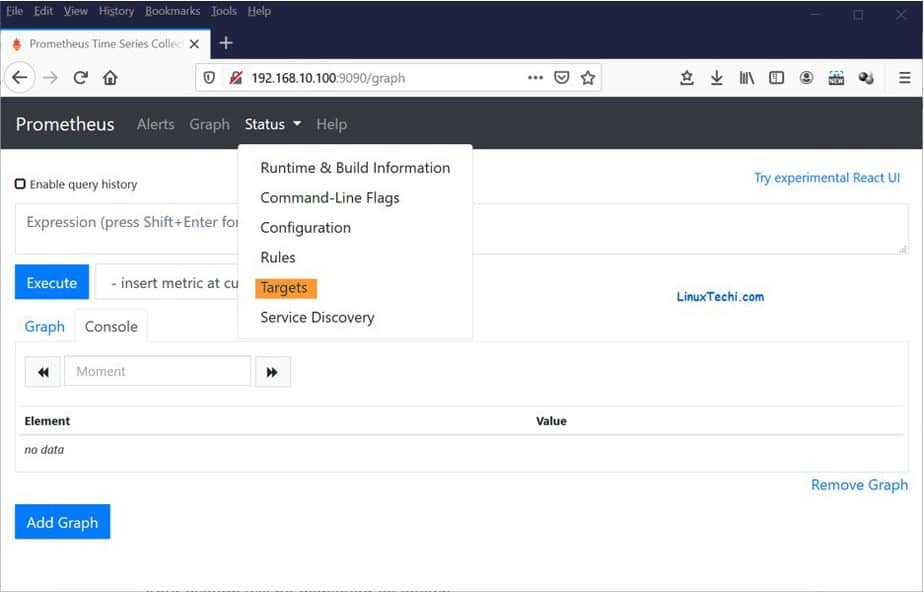
Your system will be displayed as shown
Step 6) Install & configure node_exporter
Node exporter is a utility that collects and ships a vast array of Linux system metrics such as CPU, memory usage, filesystems and network statistics. In this section, we are going to install node_exporter on the Prometheus server and on a remote CentOS 8 Linux host and monitor system metrics on the two hosts.
On the Prometheus node, we are going to create a system user for node_exporter.
[root@prometheus ~]# useradd -m -s /bin/false node_exporter
Next, head out to the downloads Page of Prometheus and download the node_exporter tarball or use below wget to command to downlond it from command line,
[root@prometheus ~]# wget https://github.com/prometheus/node_exporter/releases/download/v0.18.1/node_exporter-0.18.1.linux-amd64.tar.gz
Upon downloading the node_exporter file, proceed and extract it as shown
[root@prometheus ~]# tar -zxpvf node_exporter-0.18.1.linux-amd64.tar.gz
You can check the contents of the extracted folder using the tree command as shown
[root@prometheus ~]# tree node_exporter-0.18.1.linux-amd64
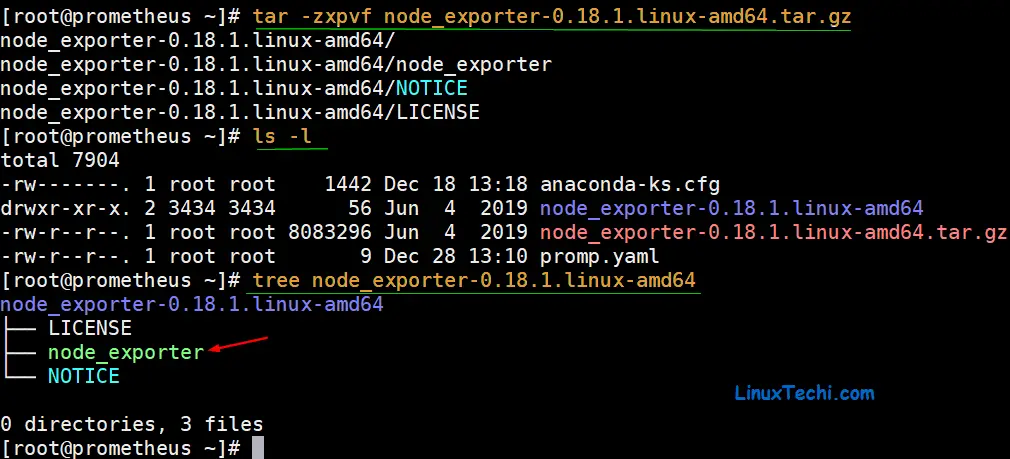
Next, copy the binary file called node_exporter to /usr/local/bin path
[root@prometheus ~]# cp node_exporter-0.18.1.linux-amd64/node_exporter /usr/local/bin
Next, set the file permissions of the node_exporter file which has been copied as shown
[root@prometheus ~]# chown node_exporter:node_exporter /usr/local/bin/node_exporter
Next, we need to configure node_exporter to run as a service. So, proceed and create a systemd service file as shown
[root@prometheus ~]# vi /etc/systemd/system/node_exporter.service
Then paste the configuration shown below and save the file
[Unit]
Description=Prometheus Node Exporter
Wants=network-online.target
After=network-online.target

[Service]
User=node_exporter
Group=node_exporter
Type=simple
ExecStart=/usr/local/bin/node_exporter

[Install]
WantedBy=multi-user.target
For the changes to take effect, reload systemd manager with the command:
[root@prometheus ~]# systemctl daemon-reload
Next, start and enable node_exporter service
[root@prometheus ~]# systemctl start node_exporter
[root@prometheus ~]# systemctl enable node_exporter
Just to be sure that the service is running, execute:
[root@prometheus ~]# systemctl status node_exporter
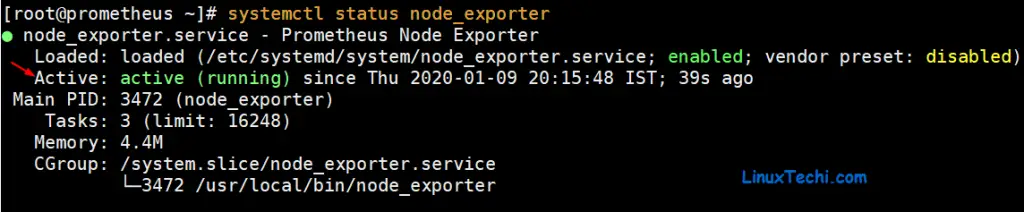
Just to be sure that the service is running, use the netstat utility to check if it’s listening on port 9100 as is expected by default.
[root@prometheus ~]# netstat -pnltu | grep 9100
tcp6       0      0 :::9100       :::*          LISTEN      3472/node_exporter
[root@prometheus ~]#
Perfect! Node_exporter service is running as expected.
Next, open port 9100 in firewall as shown
[root@prometheus ~]# firewall-cmd --add-port=9100/tcp  --permanent
success
[root@prometheus ~]# firewall-cmd --reload
success
[root@prometheus ~]#
Repeat the steps outlined for the remote CentOS 8 Linux system as well.
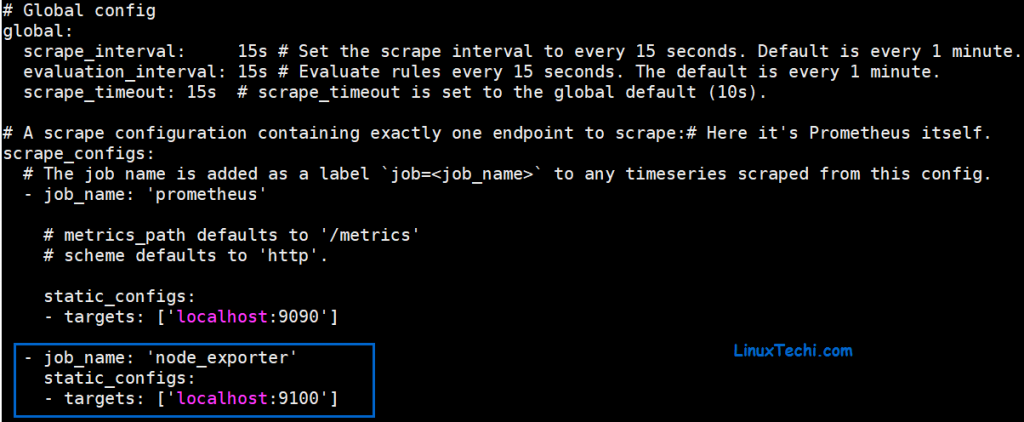
Finally, you need to add the node_exporter target to the prometheus.yml file. Append the lines below to define node_exporter for the Prometheus server
[root@prometheus ~]# vi /etc/prometheus/prometheus.yml
---------
 - job_name: 'node_exporter'
   static_configs:
   - targets: ['localhost:9100']
Restart Prometheus service
[root@prometheus ~]# systemctl restart prometheus
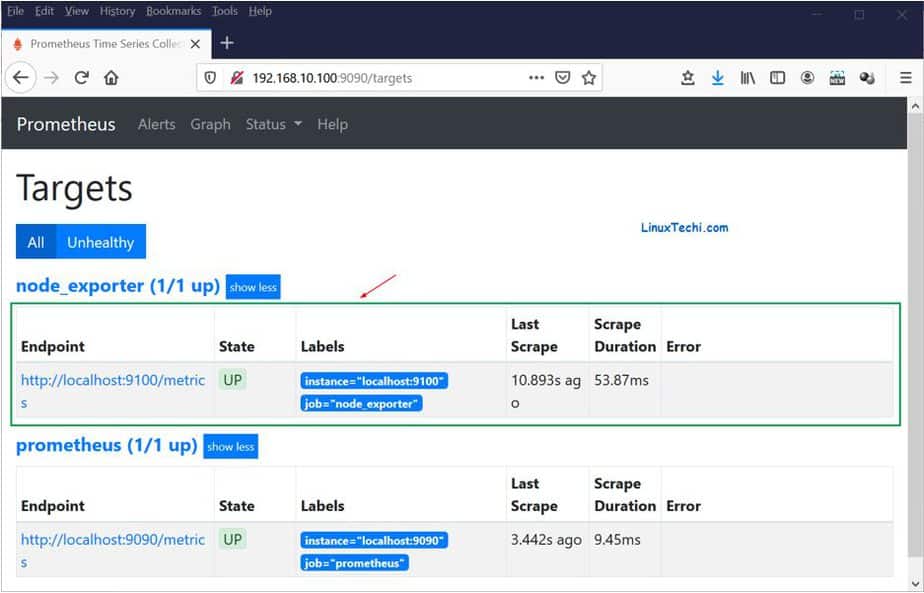
Once again, head out to your browser, click on the ‘Status’ tab and click on ‘Targets’
Be sure to observe a new endpoint on the browser called node_exporter for the Prometheus server
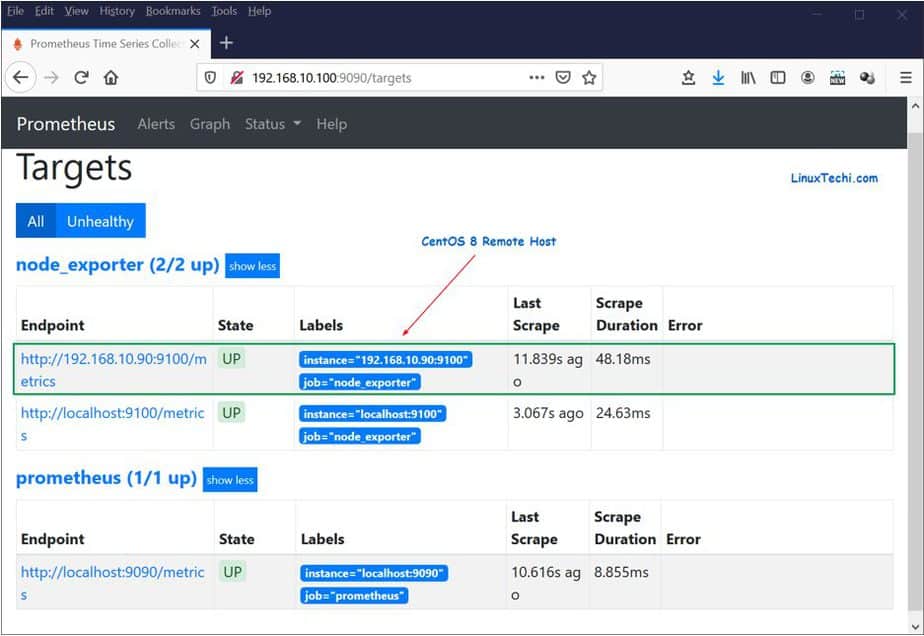
To add an endpoint for the remote Linux system head back to the prometheus.yml file and append the line below
– targets: [‘192.168.10.90:9100’]
The node_exporter section should now look like this
 - job_name: 'node_exporter'
   static_configs:
   - targets: ['localhost:9100']
   - targets: ['192.168.10.90:9100']
Save the changes and restart Prometheus service
[root@prometheus ~]# systemctl restart prometheus
Refresh the browser and notice the second endpoint that has been added for the remote CentOS Linux system
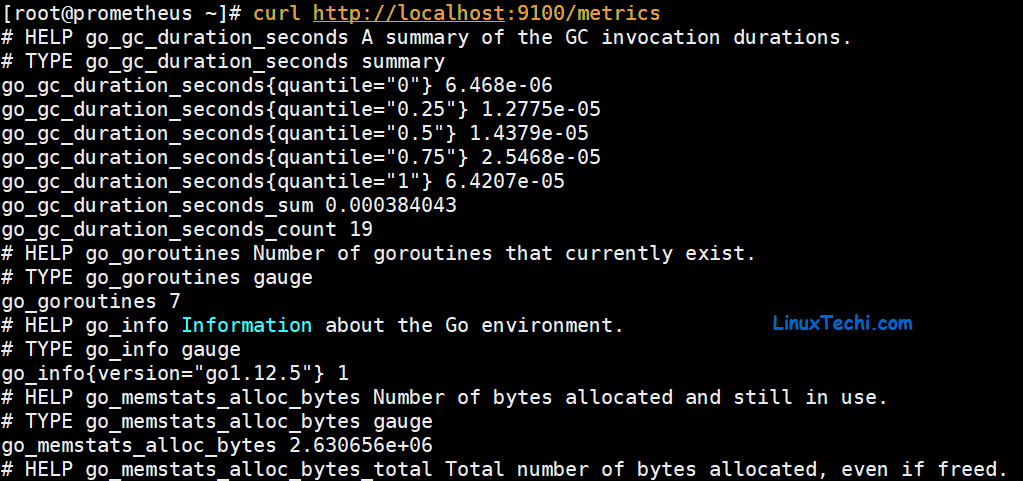
To ensure that you are receiving metrics, from your configured nodes. simply use the curl command as follows:
# curl http://node-ip:9100/metrics
For example, to display metrics from the Prometheus server run:
[root@prometheus ~]# curl http://localhost:9100/metrics
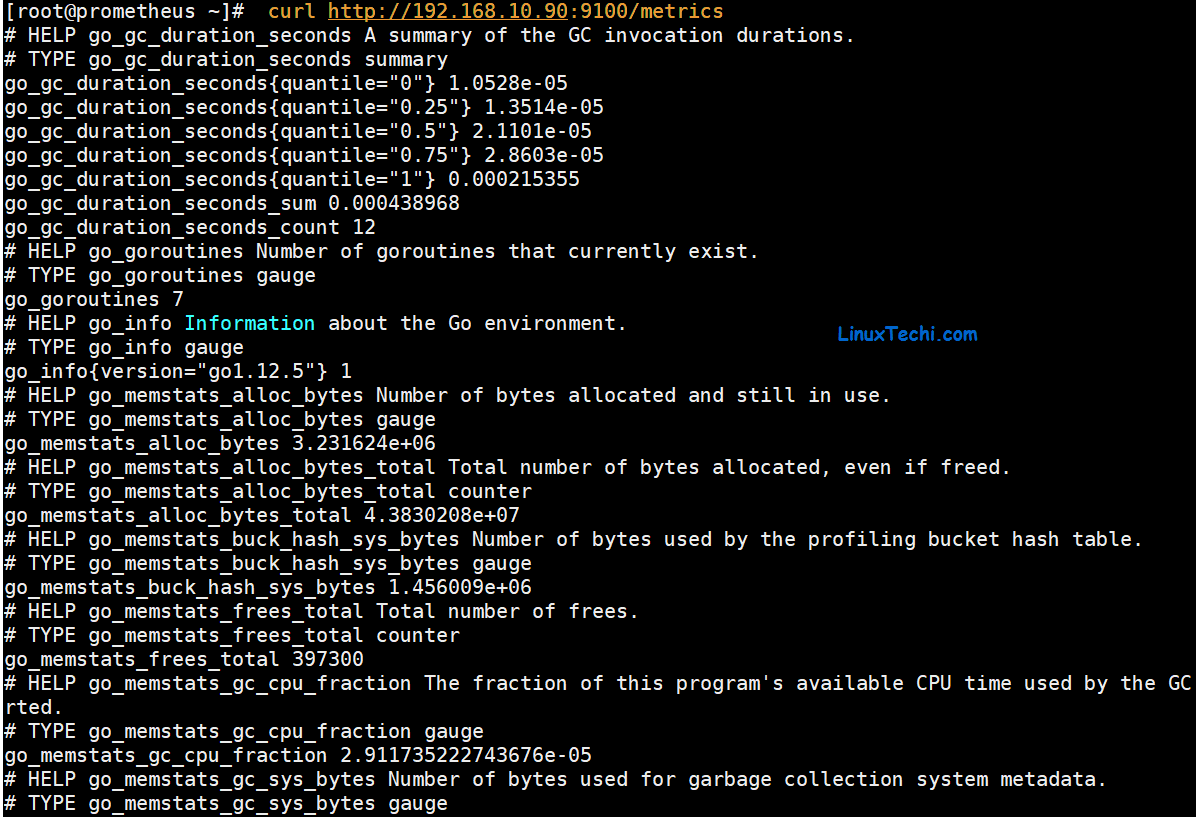
For the remote CentOS 8 host, I executed the command:
[root@prometheus ~]# curl http://192.168.10.90:9100/metrics
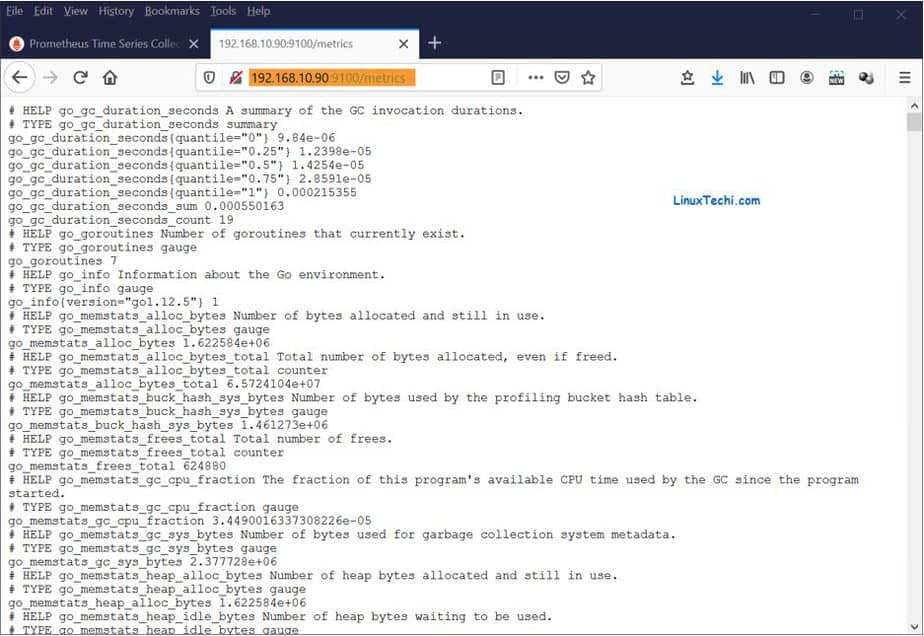
This can also be achieved by opening a browser and browsing the URL
http://192.168.10.90:9100/metrics
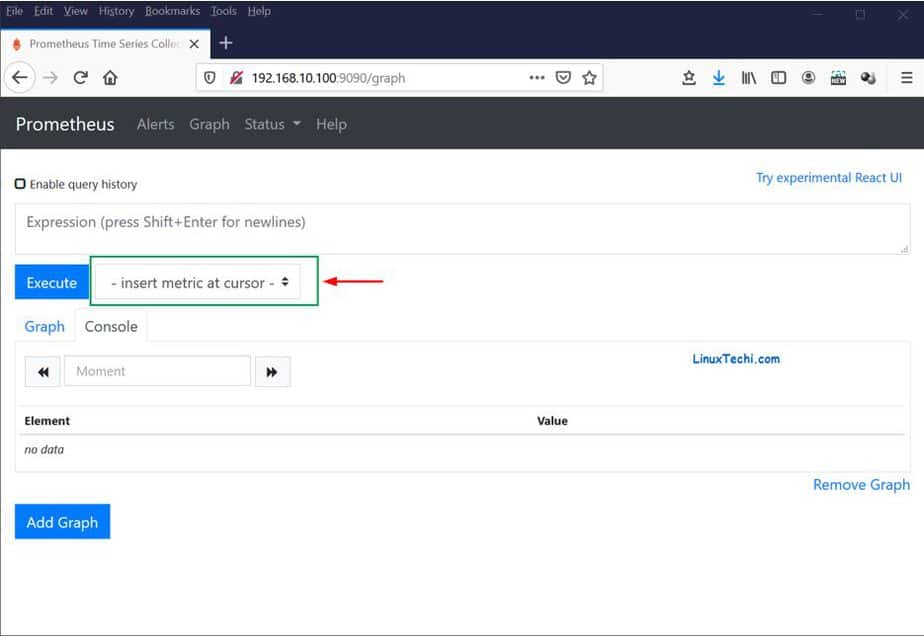
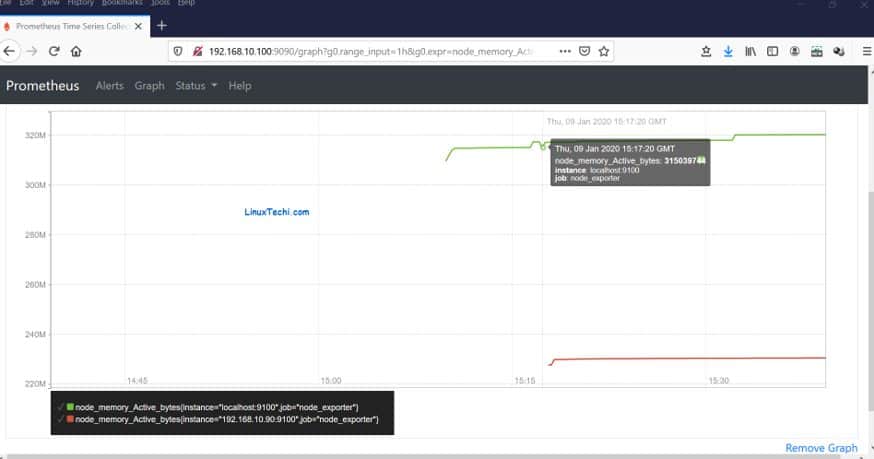
You can also choose to graph the metrics that you want. Simply go to the home page pf the Prometheus server, and click on the drop-down menu labeled ‘insert metric at cursor’.
Select the metric you want to graph,
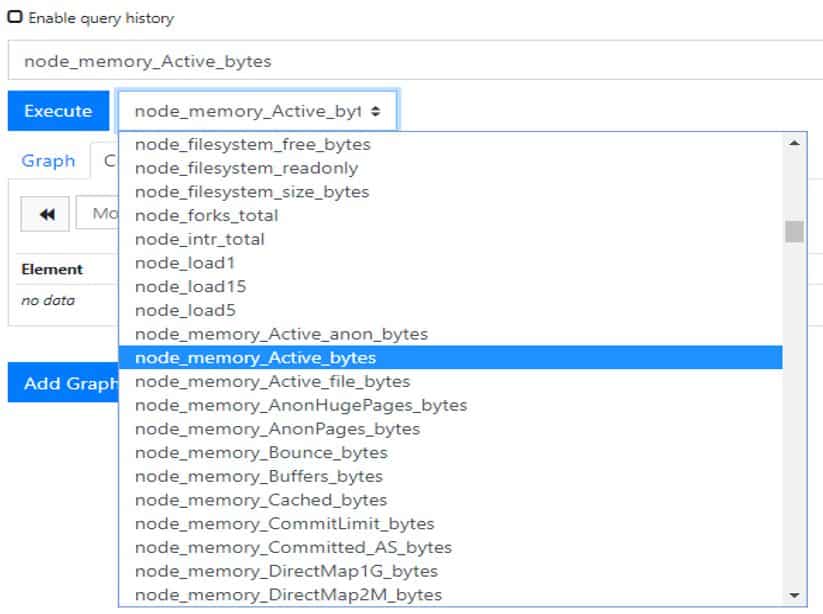
Click on the ‘Execute’ button and click on the ‘graph’ tab just below to reveal the graph
And this brings us to the end of this topic. You have successfully installed and configured Prometheus to monitor system metrics on both your server and remote host. In our next guide, we will integrate Prometheus with Grafana for better visualization and analysis of metrics. Feel free to share your feedback with us and share the article with a friend.
Also Read : How to Integrate Grafana with Prometheus for Monitoring
It was very helpful to try it out. Thank you very much! Keep it up!
Thanks for sharing, it was very helpful for me to try !!!
Thanks for sharing, it was very helpful for me to try !!!!!
Thank you for the awesome post, can you also help on enabling TLS?