Check_MK is a free and open source IT monitoring tool for Linux like Operating Systems. Check_MK is a Nagios based plugin that improves on Nagios monitoring system capabilities & performance. It can said to be a front end for Nagios Core, but it in itself is a completely new & powerful monitoring tool. It replaces the standard Nagios GUI & way the systems are monitored on Nagios, it provides graphical administration of monitoring & boosts other features like auto detection of configurations in a monitored system, specials checks in addition to Nagios checks, SNMP based agentless monitoring, filtering, viewing & alerting for log files & event data.
Check_mk allows to create rule based configurations using Python & offloading work from Nagios core system to make it scale better & thus allowing us to monitor more systems from a single nagios server.
Though it is based on nagios but it’s different in many ways than nagios like higher number of service checks i.e. a server can have up to 1000 service checks monitored, check interval time is 1 minute as opposed to 5 minutes in nagios, nagios’s latency issues are solved with focus on passive checks, rule based configurations are preferred with check_mk over explicit configuration statements.
We will now discuss the installation of Check_MK using the OMD bundle. OMD or Open Monitoring Distribution is a bundle that includes Nagios & all the required plugins needed for monitoring. It also has Check_MK bundled along with nagios monitoring. OMD is available for a number of Linux distributions, but we will be using OMD on CentOS 7 servers.
In this tutorial I will be using the following Servers:
- 192.168.1.45 – CentOS 7 ( Check_MK Server)
- 192.168.1.91 – CentOS 7 ( Linux Host )
- 192.168.1.92 – Windows Server 2012 R2 ( Windows Host )
Prerequisites for Check_MK Server
- Make sure that we that we have xinetd and openssl installed on our system, it’s actually comes pre-installed on most of the linux distributions, Use below command to install xinetd and openssl
[root@linuxtechi ~]# yum install xinetd openssl -y
- Python also needs to be installed on the machine. Check_mk supports Python 2.3+ versions & still does not support Python 3.Run below command to install python
[root@linuxtechi ~]# yum install python -y
In the default CentOS 7 and RHEL 7 yum repositories python 2.7 is available.
- We need to have EPEL repository installed on our system, as OMD uses some packages that are not available on default CentOS repositories but are available on EPEL repositories. To install EPEL repository on CentOS 7 system, open the terminal & execute the below mentioned command,
[root@linuxtechi ~]# yum install epel-release -y
Once the repository has been installed & enabled, we will Set the firewall and selinux rules for check_mk and then move on with the installation part.
Firewall and SELinux Rule for check_mk
In case firewall is running on your CentOS 7 / RHEL 7 Server then allow port 80 using the following command.
[root@linuxtechi ~]# firewall-cmd --permanent --zone=public --add-port=80/tcp
[root@linuxtechi ~]# firewall-cmd --reload
SELinux Rule for check_mk
[root@linuxtechi ~]# setsebool -P httpd_can_network_connect 1
Installation of Check_MK
As mentioned above, OMD is available for a number of Linux distributions & we can download pre-built packages for all these distros. So we will first have to get rpm from OMD’s Official Website ( http://omdistro.org/) . To download the rpm, run
[root@linuxtechi ~]# wget https://mathias-kettner.de/support/1.4.0p12/check-mk-raw-1.4.0p12-el7-59.x86_64.rpm
Now we will install the OMD rpm using the yum command. We are using yum as it will also install all the dependencies required for OMD installation,
[root@linuxtechi ~]# yum install --nogpgcheck check-mk-raw-1.4.0p12-el7-59.x86_64.rpm
The option –nogpgcheck is needed as the omd package is not signed & might throw an error during installation. Our OMD package has now been installed, we will now configure it to use the Check_MK package.
Check_MK Configurations
Firstly, after omd installation, we need to create a instance on OMD. We can create a number of instance on OMD like one for production, one for testing (sandbox) or simply one instance for monitoring etc.
So to create the instance, execute the following command,
[root@linuxtechi ~]# omd create sandbox
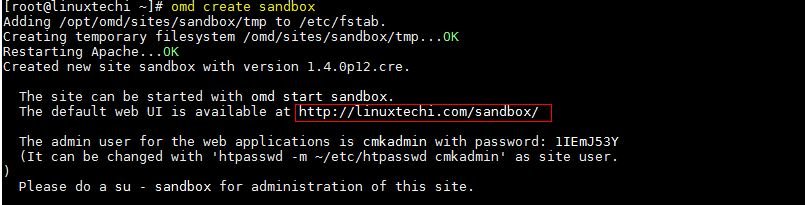
Above command will create a new instance on omd, along with a user & group named ‘sandbox’, also a home folder for the user ‘sandbox’ is created under ‘/omd/sites/sandbox’. Now to start the instance, we will switch to that user & run ,
[root@linuxtechi ~]# su - sandbox
OMD[sandbox]:~$ omd start
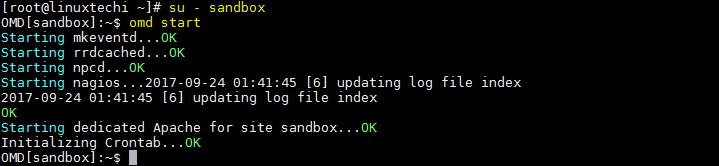
This will start the sandbox instance that we have created & we can access it through the Web browser with the following link,
http://<Your_Servr_IP_Address>/sandbox
Use the user name as “cmkadmin” and password was there in command output when we create sandbox instance. Though we can change the password using the beneath command:
OMD[sandbox]:~$ htpasswd -m ~/etc/htpasswd cmkadmin
Once we have logged in, we will able to see the dashboard for check_mk.
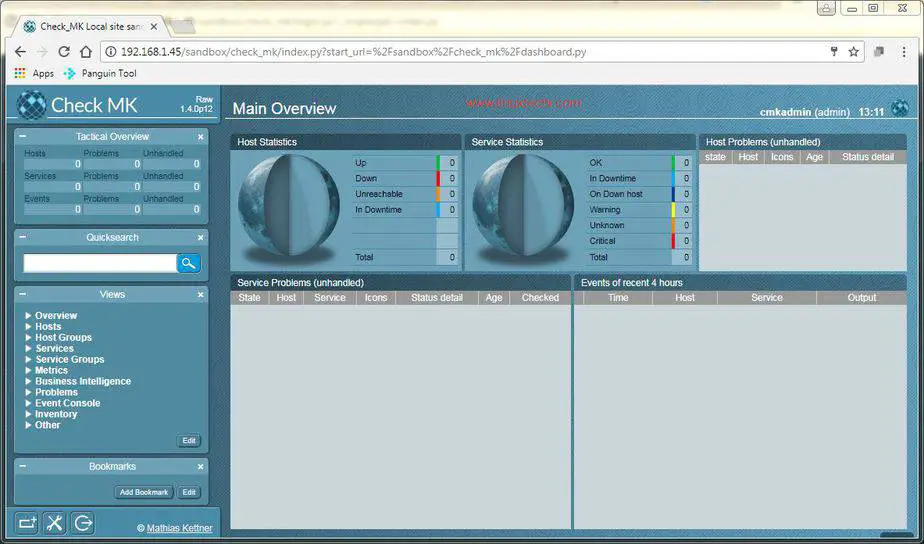
It’s showing empty for all the servers & services as we have not enabled any service as of now & that’s what we will do in our next step.
Adding a Linux host to Check_MK
Now we will add a Linux host (CentOS 7 / RHEL 7), To add any Linux host to Check_MK we require to install Check_mk Agent. Check_mk agent package can downloaded from OMD instance or ChecK_MK Server from URL:
http://<Server-IP-Address>/sandbox/check_mk/agents/
We can also download from official website. To Install ‘check_mk_agent’ rpm from command line, use below command:
[root@dbserver ~]# rpm -ivh http://192.168.1.45/sandbox/check_mk/agents/check-mk-agent-1.4.0p12-1.noarch.rpm
Allow port in firewall in case it is running on Linux Host
[root@dbserver ~]# firewall-cmd --permanent --add-port=6556/tcp
[root@dbserver ~]# firewall-cmd --reload
As we have installed agent installed in one of linux system, Next task is to add the host details through check_mk Web UI. To do that , open the Check_mk Web UI & navigate to ‘WATO-Configuration’ , than select ‘Hosts’ & in ‘Hosts’ , select ‘Create new host’
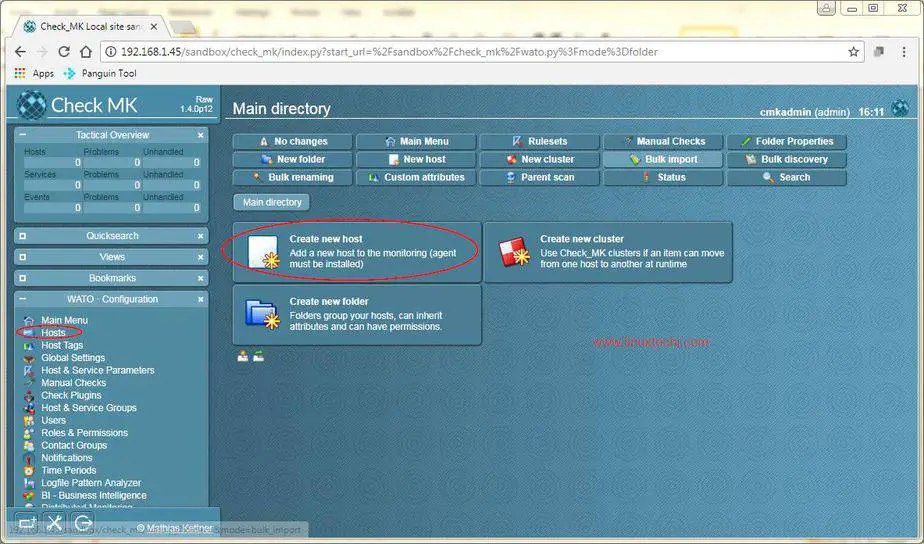
Provide the details as mentioned in the screenshot i.e. hostname, IP address & agent type.
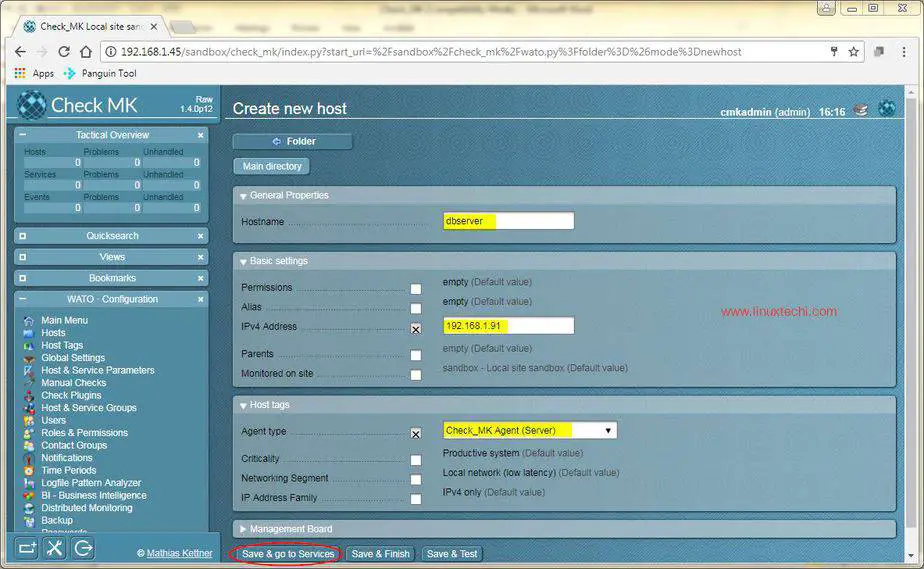
After the details have been entered, click on ‘Save & go to Services‘. Within 10-20 seconds, a list of services will be populated automatically,
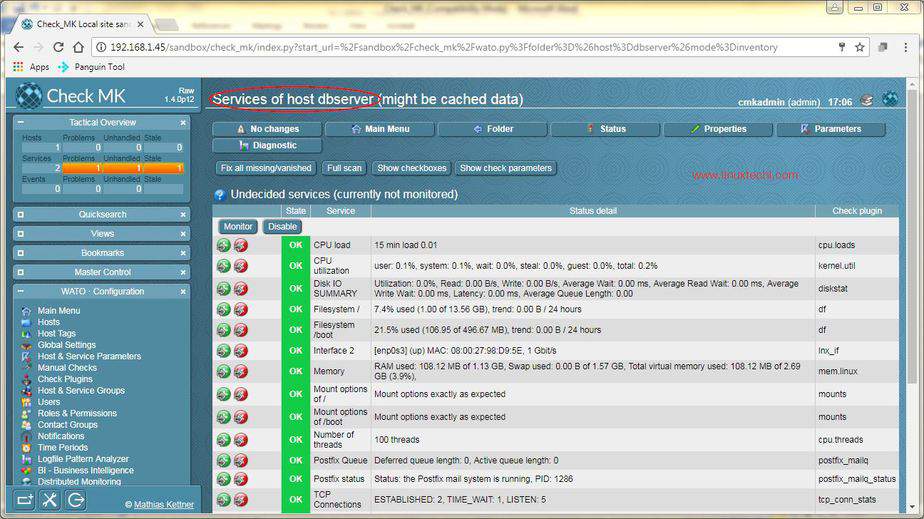
This concludes the registration of Linux Server to Monitoring Solution (check_mk). Now we can start monitoring services and other parameters of Linux Host from Check_MK Web UI.
Adding a Windows Host to Check_MK
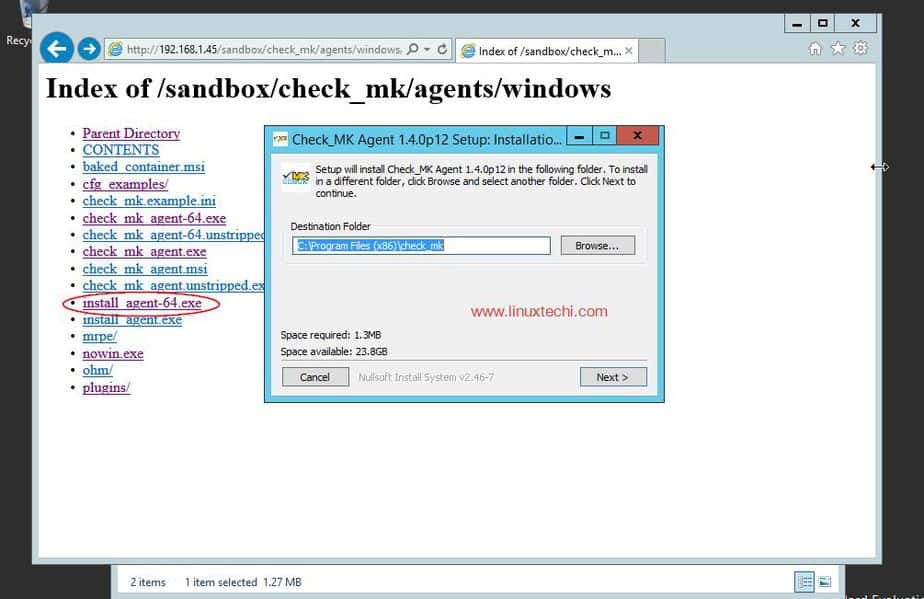
Now we will add a Windows host machine to Check_mk, to do this download agent setup from omd server or check_MK server
http://192.168.1.45/sandbox/check_mk/agents/windows/
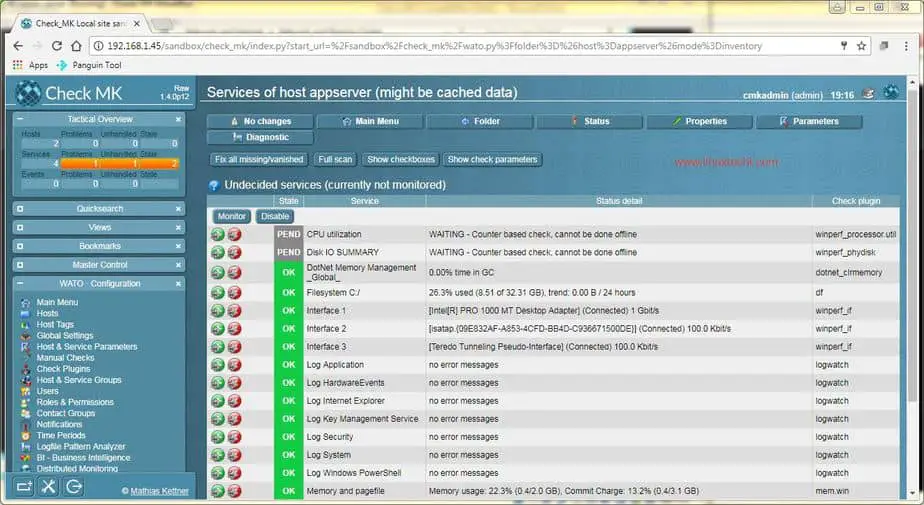
Once the installation of agent has been completed on Client machine, we will get something like below :
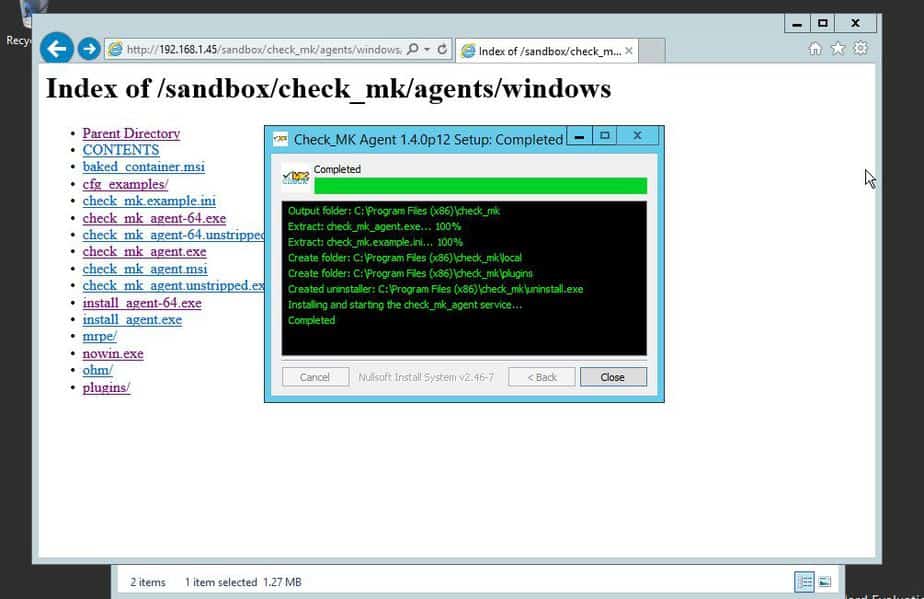
Add new host using Check_mk Web UI, as we did above. Once host has been created the services page will automatically pull the status of all the services.
This completes our tutorial, Please share your feedback and comments.
Read Also : How to Install Zabbix Server 4.x on CentOS 7 / RHEL 7
Hi Team
if i want to do any customization , like i want to include any inhouse developed daemon in check_mk monitoring , is there any way i can write my own plugin ?using python or some langauge ?
please guide