Logs analysis has always been an important part system administration but it is one the most tedious and tiresome task, especially when dealing with a number of systems. Fortunately, ELK stack has eased up the task, ELK stack is now used for log inspection/analysis & it’s a combination of following three open source products
- ElasticSearch -It is a No-SQL database that indexes and stores information
- Logstash – It is a log pipeline tool that collects & parses logs
- Kibana – It provides GUI(Graphical User Interface) and used for visualization of the data & works on top of elasticsearch.
ELK stack receives logs from client through beats protocol, sent by using a beats client.In this tutorial, we are going to create an ELK stack on a Centos 7 machine & will also install beat client named ‘File Beat’ on the Client Machine.
- 192.168.0.180 elk-stack (CentOS 7)
- 192.168.0.70 client (CentOS 7)
Pre-requisite
Machine on which we will install ELK should have Java version 8 installed on it as . So make sure that java open-jdk version 1.8.0_* is installed and running and in case it is not installed, then run the beneath yum command to install
[root@elk-stack ~]# yum install java-1.8.0-openjdk
[root@elk-stack ~]# java -version
openjdk version "1.8.0_131"
OpenJDK Runtime Environment (build 1.8.0_131-b12)
OpenJDK 64-Bit Server VM (build 25.131-b12, mixed mode)
[root@elk-stack ~]#
Set the Hostname and update /etc/hosts file
[root@elk-stack ~]# hostnamectl set-hostname "elk-stack.example.com"
Update /etc/hosts file
192.168.0.180 elk-stack.example.com elk-stack
Installation Steps of ELK Stack
Elasticsearch
We will start by importing the GPG keys for elasticsearch, this key will also be shared with logstash & kibana. To install elasticsearch, run
[root@elk-stack ~]# rpm –import https://packages.elastic.co/GPG-KEY-elasticsearch
[root@elk-stack ~]#
Now we will create a repo for the elastic-search repository,
[root@elk-stack ~]# vi /etc/yum.repos.d/elasticsearch.repo

[elasticsearch]
name=Elasticsearch repository
baseurl=http://packages.elastic.co/elasticsearch/2.x/centos
gpgcheck=1
gpgkey=http://packages.elastic.co/GPG-KEY-elasticsearch
enabled=1
Once the repository has been added, install elasticsearch using yum,
[root@elk-stack ~]# yum install elasticsearch -y
Now we start the service & will also set to start at boot time
[root@elk-stack ~]# systemctl daemon-reload
[root@elk-stack ~]# systemctl start elasticsearch
[root@elk-stack ~]# systemctl enable elasticsearch
Allow the 9200 tcp port in the OS firewall. In case Firewall is running
[root@elk-stack ~]# firewall-cmd --permanent --add-port 9200/tcp
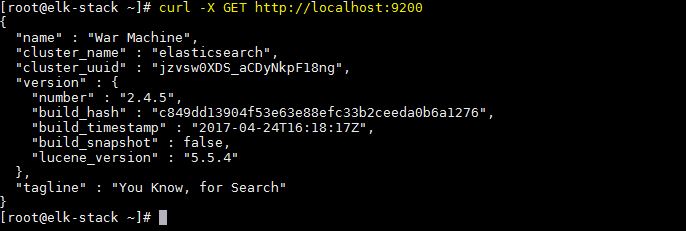
We will now test elasticsearch to make sure that its responding to queries
[root@elk-stack ~]# curl -X GET http://localhost:9200
Output of above command should be something like below:
Logstash
We will now add logstash repository,
[root@elk-stack ~]# vi /etc/yum.repos.d/logstash.repo

[logstash]
name=Logstash
baseurl=http://packages.elasticsearch.org/logstash/2.2/centos
gpgcheck=1
gpgkey=http://packages.elasticsearch.org/GPG-KEY-elasticsearch
enabled=1
Now install logstash,
[root@elk-stack ~]# yum install logstash -y
Kibana
We will now create a repository for kibana,
[root@elk-stack ~]# vi /etc/yum.repos.d/kibana.repo

[kibana-4.5]
name=Kibana repository for 4.5.x packages
baseurl=http://packages.elastic.co/kibana/4.5/centos
gpgcheck=1
gpgkey=http://packages.elastic.co/GPG-KEY-elasticsearch
enabled=1
Now install kibana using yum,
[root@elk-stack ~]# yum install kibana -y
After installation, start service & enable it at boot time
[root@elk-stack ~]# systemctl start kibana
[root@elk-stack ~]# systemctl enable kibana
Allow 5601 port in OS Firewall
[root@elk-stack ~]# firewall-cmd --permanent --add-port 5601/tcp
[root@elk-stack ~]# firewall-cmd --reload
Next, we will access the webpage for kibana to make sure it’s working. To do that, open web-browser & enter the following url
http://IP-Address:5601/
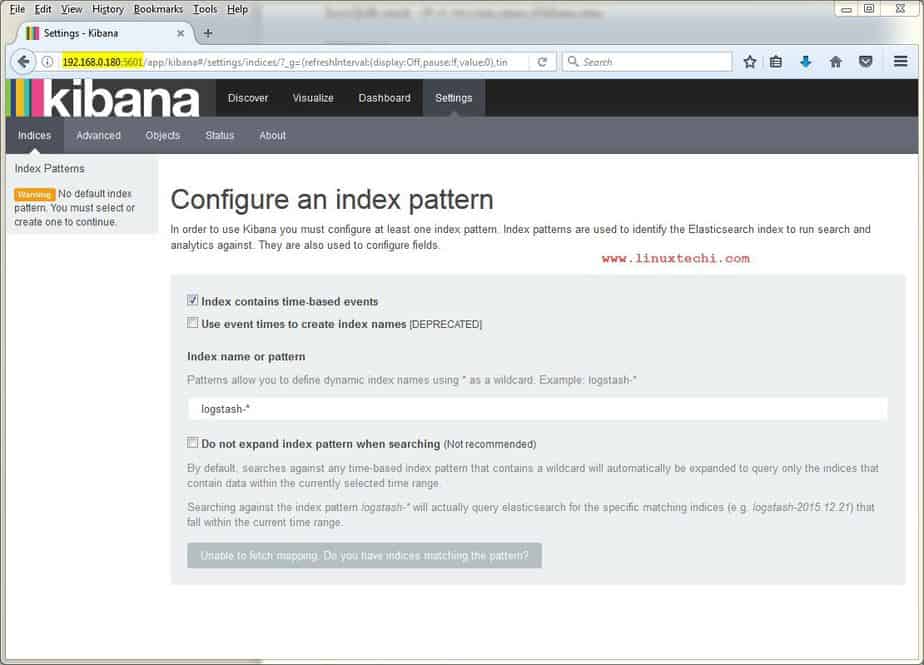
Installation of ELK stack is now complete & we will make the necessary configurations.
Configuration
SSL certificate for logstash
After the logstash installation, we will now create a SSL certificate for securing communication between logstash & filebeat (clients). Since we will be using IP address to connect to server, we will create SSL certificate for IP SAN.
Before creating a SSL certificate, we will make an entry of our IP in openssl.cnf,
[root@elk-stack ~]# vi /etc/pki/tls/openssl.cnf
and look for parameter with ‘subjectAltName’ under [ v3_ca ] section & add your server IP to it,
subjectAltName = IP: 192.168.0.180
Now change the directory to /etc/ssl & create SSL certificate with 365 days validity,
[root@elk-stack ~]# cd /etc/ssl/
[root@elk-stack ssl]# openssl req -x509 -days 365 -batch -nodes -newkey rsa:2048 -keyout logstash-forwarder.key -out logstash_frwrd.crt
Generating a 2048 bit RSA private key
.....+++
...........+++
writing new private key to 'logstash-forwarder.key'
-----
[root@elk-stack ssl]#
Once the certificate is ready, this should be copied to all the clients using scp command.
Configuring Logstash
We will now create a configuration file for logstash under the folder ‘/etc/logstash/conf.d‘. This file will be divided into three sections i.e. input, filter & output section
[root@elk-stack ~]# vi /etc/logstash/conf.d/logstash.conf

# input section
input {
 beats {
   port => 5044
   ssl => true
   ssl_certificate => "/etc/ssl/logstash_frwrd.crt"
   ssl_key => "/etc/ssl/logstash-forwarder.key"
   congestion_threshold => "40"
  }
}
This section makes logstash to listen on port 5044 for incoming logs & also provides SSL certificate details for secure connection.
Next section i.e. ‘filter section’ will parse the logs before sending them to elasticsearch ,
# Filter section
filter {
if [type] == "syslog" {
    grok {
      match => { "message" => "%{SYSLOGLINE}" }
    }
    date {
match => [ "timestamp", "MMM  d HH:mm:ss", "MMM dd HH:mm:ss" ]

}
  }
}
Last section is ‘output section’ & it defines the location for the storage of logs,
# output section
output {
 elasticsearch {
  hosts => localhost
    index => "%{[@metadata][beat]}-%{+YYYY.MM.dd}"
       }
stdout {
    codec => rubydebug
       }
}
Now save the file & exit. All these sections can also be divided into three separate files but we have used them in single file for ease of configuration. We will now start the logstash service & enable it at boot time,
[root@elk-stack ~]# systemctl daemon-reload
[root@elk-stack ~]# systemctl start logstash
[root@elk-stack ~]# systemctl enable logstash
Allow 5044 tcp port in the OS firewall with following command so that Logstash get logs from Clients
[root@elk-stack conf.d]# firewall-cmd --permanent --add-port=5044/tcp
success
[root@elk-stack conf.d]# firewall-cmd --reload
success
[root@elk-stack conf.d]#
Installing Filebeat on Clients
Filebeat needs to installed on every system for which we need to analyse logs. Let’s first Copy certificate file from elk-stack server to the client
[root@elk-stack ~]# scp /etc/ssl/logstash_frwrd.crt root@192.168.0.70:/etc/ssl
To install filebeat, we will first add the repo for it,
[root@client1 ~]# vi /etc/yum.repos.d/filebeat.repo
[beats]
name=Elastic Beats Repository
baseurl=https://packages.elastic.co/beats/yum/el/$basearch
enabled=1
gpgkey=https://packages.elastic.co/GPG-KEY-elasticsearch
gpgcheck=1
Now install filebeat by running beneath command
[root@client1 ~]# yum install filebeat
We will now make changes to the configuration file to connect the filebeat clients to our ELK stack but before we do that make sure that the certificate we created during logstash configuration is copied on the client under ‘/etc/ssl’ directory. Once that’s done, we will start the filebeat configuration,
[root@client1 ~]# vi /etc/filebeat/filebeat.yml
We need to make changes to the following three sections,
.  .  .
       paths:
        - /var/log/*.log
        - /var/log/secure
        - /var/log/messages
.  .  .
Under this section, we can allow the logs that needs to be analysed. I have left it at default i.e. all logs but you can modify it to send only one or two log files. For the next section, change the document_type to ‘syslog’,
.  .  .
      document_type: syslog
.  .  .
& in the last section i.e ‘output’, we will define our ELK stack server IP address & location for the ssl certificate,
.   .   .
output:
  logstash:
    hosts: ["192.168.0.180:5044"]
    tls:
      certificate_authorities: ["/etc/ssl/logstash_frwrd.crt"]
.   .   .
Note: Disable elasticsearch output, comment out the entry “hosts: [“localhost:9200″]” in case it is enable.
Now start the service & enable it at boot time,
[root@client1 ~]# systemctl restart filebeat
[root@client1 ~]# systemctl enable filebeat
That’s it, configurations on both server end & client end are now complete. We can now login to the kibana web interface to look for analysed logs.
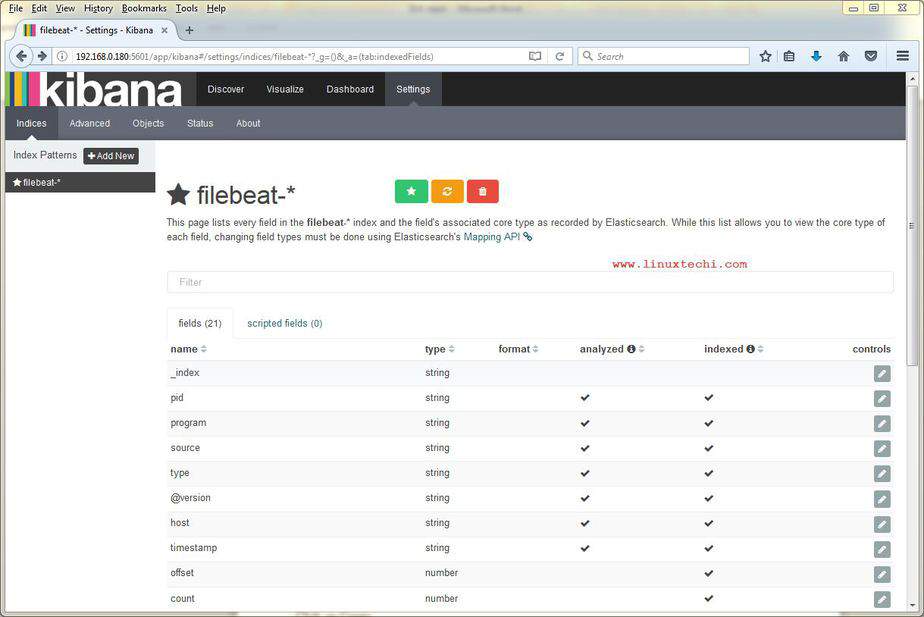
Create Index Pattern, change logstash-* to filebeat-*
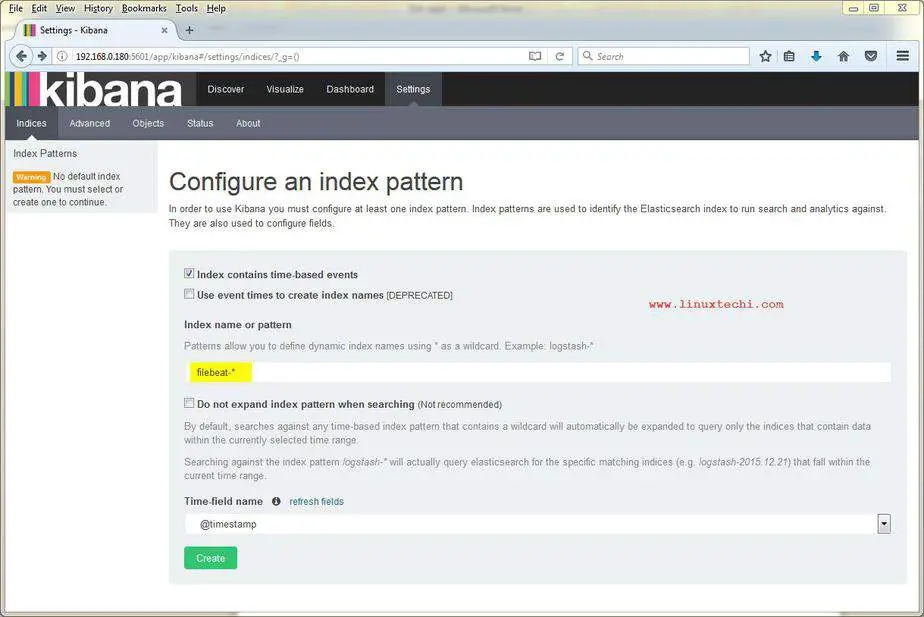
Click on Create
Click on Discover and then search, we will get logs something like below
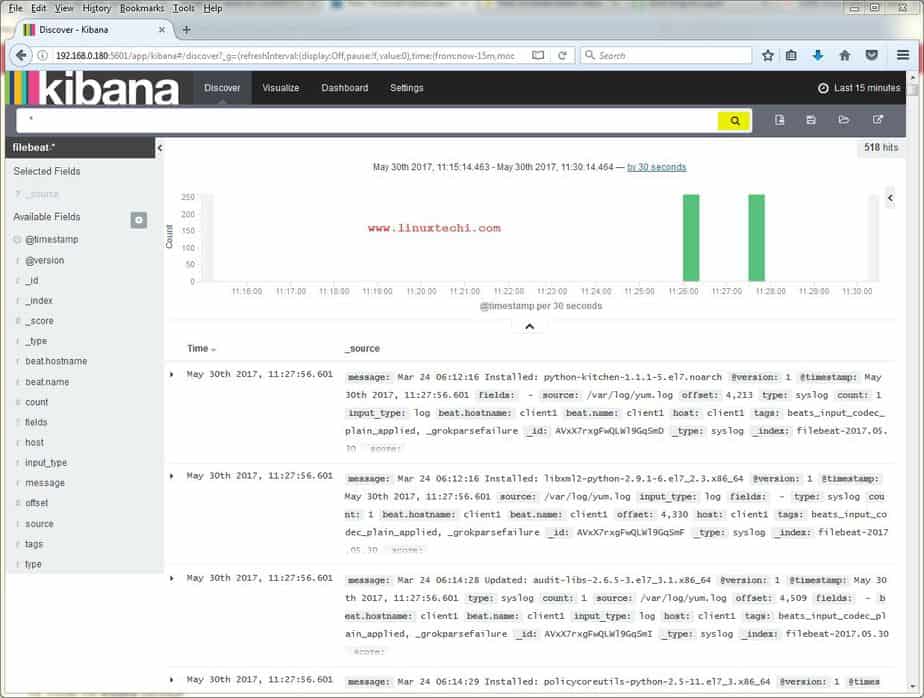
That’s all from this article, Please share your valuable feedback and comments.
Nice article. Thanks. But we are facing one problem. The filebeat is not sending the logs to Logstash as logs changes at client . We need to restart the filebeat every time on client to send the logs. Is there any setting which defines auto sending of Logs or time-interval at which file beat sends the logs ?
Hi Shashank,
You need to edit your client’s filebeat.yml file. Update the entries whatever we discuss in document and also make sure you comment out the following lines in filebeat.yml
### Elasticsearch as output
#elasticsearch:
#hosts: [“localhost:9200”]
Restart the filebeat service on client and then restart logstash service on elk server. To perform testing logout from your client and then re-login and verify the logs on Kibana, Logs should be updated for your client.
hi Pradeep,
I found an error during creation SSL certificate with 365 days validity. please give a check I looked it for in webpages but I dont find any fix.
thanks in advnace
openssl req -x509 -days 365 -batch -nodes -newkey rsa:2048 -keyout logstash-forwarder.key -out logstash_frwrd.crt
Error Loading extension section v3_ca
139742382225312:error:2207507C:X509 V3 routines:v2i_GENERAL_NAME_ex:missing value:v3_alt.c:537:
139742382225312:error:22098080:X509 V3 routines:X509V3_EXT_nconf:error in extension:v3_conf.c:93:name=subjectAltName, val ue=10.1.1.41
Daniel,
I’m pretty sure you entered a typo. Recheck the openssl conf file and ensure you’ve entered the following under the [v3_ca]:
subjectAltName = IP: 10.1.1.41
Unable to fetch mapping. Do you have indices matching the pattern…I couldn’t create index pattern bcoz it shows this area as transparent in the start page
i have the same error is there any solution !!!
yum install filebeat
file contain pasring errors:file:///etc/yum.repos.d/filebeat.respo
Such a nice article. Thanks A Lot
Hi,
Files are not appearing in Kibana screen. I did all the above settings. can anyone guide me?
AWESOME! faced a few problems with filebeat config but managed to get it working, great article.
I am trying to install and run ELK on RHEL. I have installed with root user as it requires permissions for /etc directory but not able to run it with root user because the below error
org.elasticsearch.bootstrap.StartupException: java.lang.RuntimeException: can not run elasticsearch as root.
Hi Imran,
I am trying to install the same but unfortunately I am not able to do it can you please help me out with this??
Regards,
Viswanath Reddy Y
There is an issue with my filebeat yml file, I have tried to check status of filebeat daemon and run below command to verify the config file
filebeat -configtest -c /etc/filebeat/filebeat.yml
It will show you the actual issue inside the file, once you correct the file restart filebeat and check the status of filebeat. you will b able to install kibana successfully
Error Initialising publisher: open etc/ssl/logstash_frwrd.crt: no such file or directory
i am getting this issue
.