In this blog post, we will show you how to install Kubernetes dashboard using helm step-by-step, empowering you to streamline your Kubernetes management tasks.
Kubernetes, an open-source container orchestration platform, has become the go-to solution for managing containerized applications at scale. While Kubernetes provides powerful command-line tools for managing clusters, sometimes a visual interface can make monitoring and managing your deployments even easier. Kubernetes Dashboard is a web-based user interface that allows you to visualize and interact with your Kubernetes clusters.
Prerequisites
Before installing Kubernetes Dashboard, ensure that you have a running Kubernetes cluster and have the necessary administrative access.
Installing Kubernetes Dashboard
The easy way to install Kubernetes dashboard for your cluster is via helm chart. Latest Kubernetes dashboard now has a dependency on cert-manager and nginx-ingress-controller. Fortunately, these dependencies can be automatically installed using the Helm chart. However, if you already have these components installed, you can disable their installation by setting the flags —set=nginx.enabled=false and –set=cert-manager.enabled=false when installing the chart.
Without any further delay, let’s jump into Kubernetes dashboard installation steps,
1) Install Helm
Access your cluster’s master node using a terminal or command prompt. Install helm if not installed. Run the following commands.
$ curl -fsSL -o get_helm.sh https://raw.githubusercontent.com/helm/helm/main/scripts/get-helm-3
$ chmod 700 get_helm.sh
$ ./get_helm.sh

2) Add Kubernetes Dashboard Helm Repository
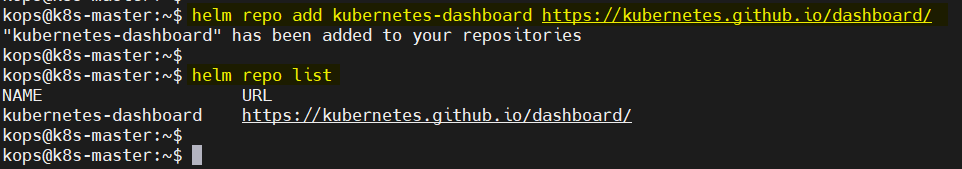
Run following helm command to add dashboard repository,
$ helm repo add kubernetes-dashboard https://kubernetes.github.io/dashboard/
$ helm repo list
3) Install Kubernetes Dashboard Using Helm
To install Kubernetes dashboard using helm, run following command,
$ helm upgrade --install kubernetes-dashboard kubernetes-dashboard/kubernetes-dashboard --create-namespace --namespace kubernetes-dashboard

Output above confirms dashboard has been deployed in Kubernetes-dashboard namespace. So, in order to access dashboard from the cluster locally, run
$ export POD_NAME=$(kubectl get pods -n kubernetes-dashboard -l "app.kubernetes.io/name=kubernetes-dashboard,app.kubernetes.io/instance=kubernetes-dashboard" -o jsonpath="{.items[0].metadata.name}")
$ kubectl -n kubernetes-dashboard port-forward $POD_NAME 8443:8443

Now, open the web browser of system on which you have run above command, type following URL
https://localhost:8443
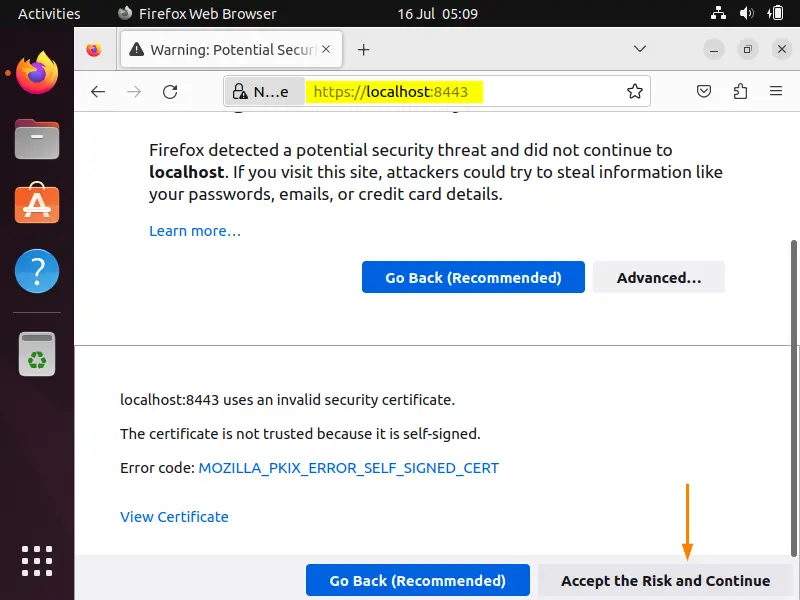
Click on “Accept the Risk and Continue”
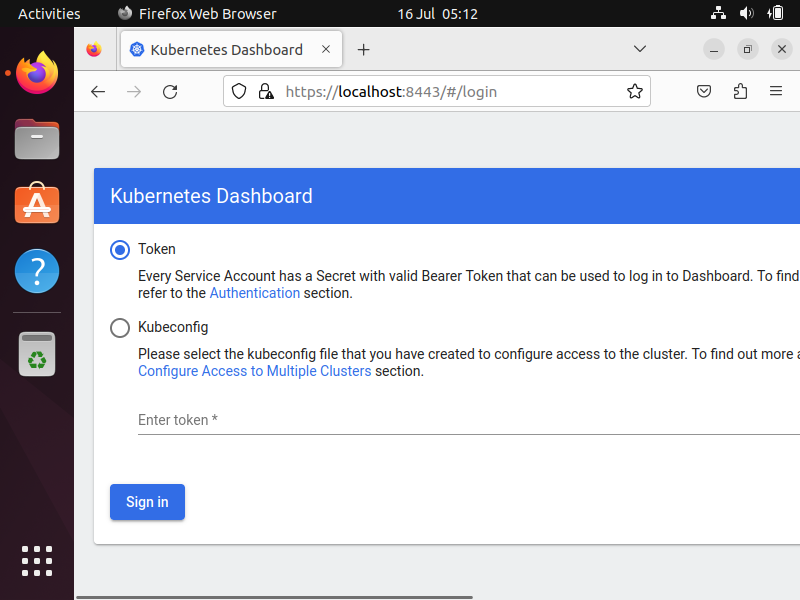
As you can see above, we need a token to login. So, let’s generate the required token in the next step.
Accessing Kubernetes Dashboard from Outside
In case you want to access dashboard from outside of Kubernetes cluster then expose the Kubernetes-dashboard deployment using NodePort type, as show below:
$ kubectl expose deployment kubernetes-dashboard --name k8s-svc --type NodePort --port 8443 -n kubernetes-dashboard
Check the dashboard service, run
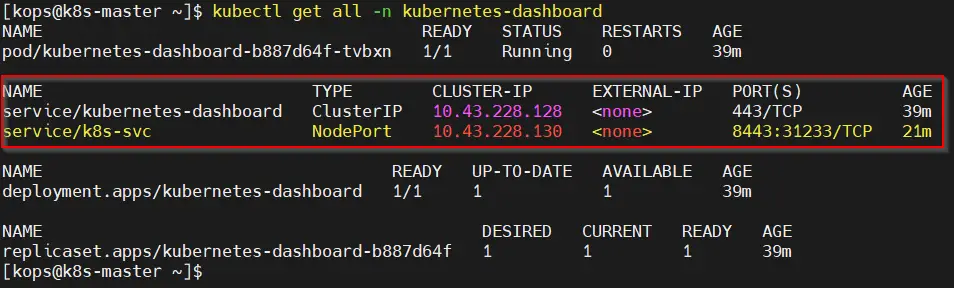
Next, try to access dashboard from outside of cluster using the URL:
https://<Worker-IP-Address>:31233
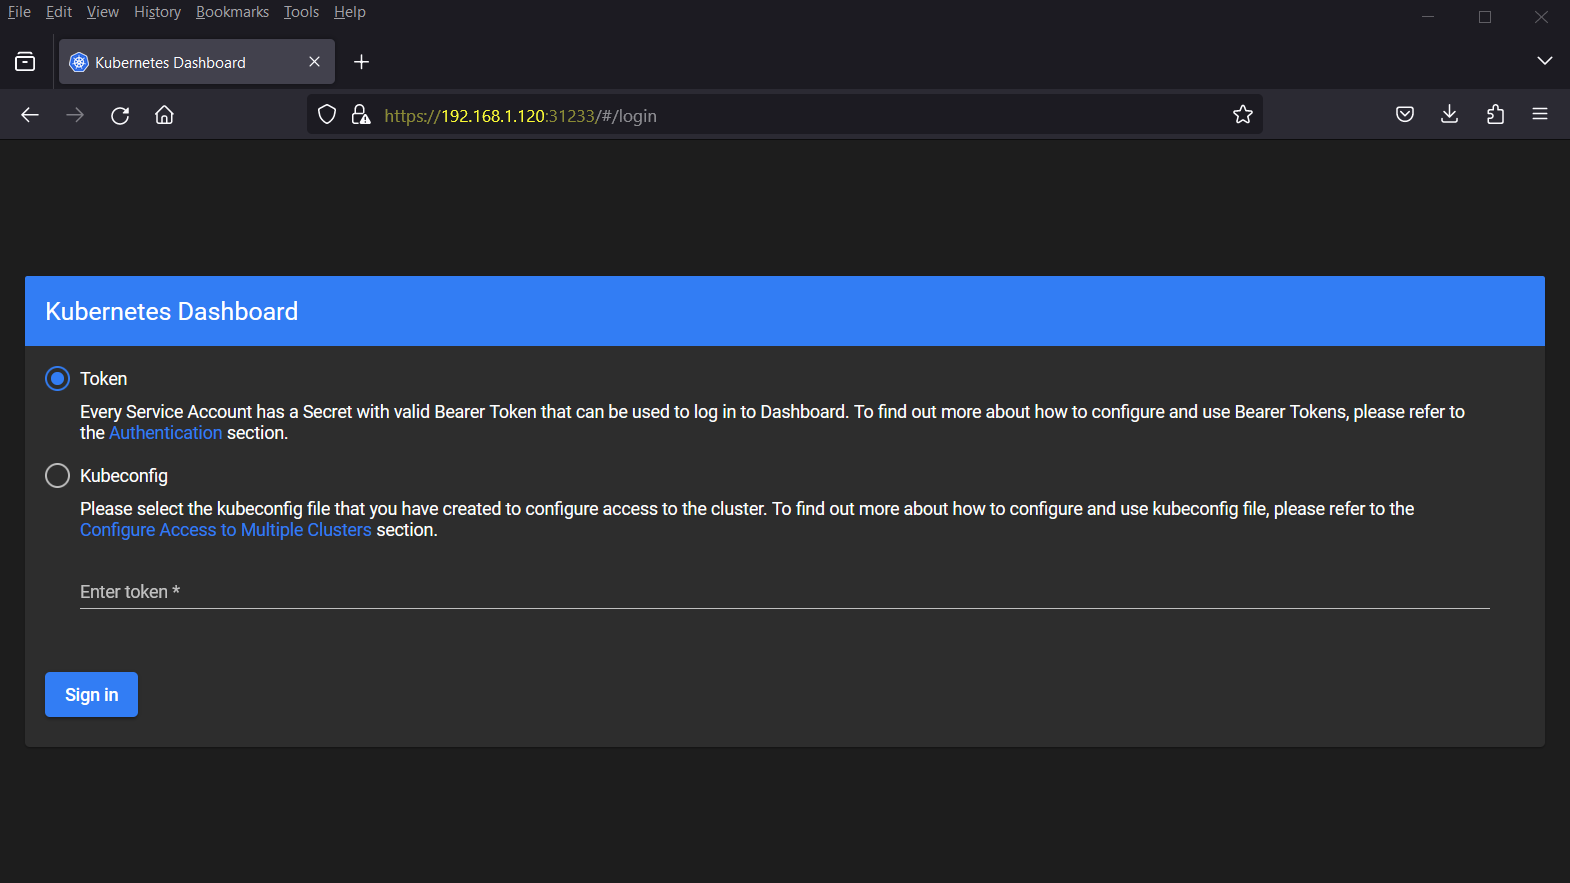
4) Generate Token for Kubernetes Dashboard
Open one more ssh session to master node and create a service account and assign required permissions using following yaml file,
$ vi k8s-dashboard-account.yaml
apiVersion: v1
kind: ServiceAccount
metadata:
  name: admin-user
  namespace: kube-system
---
apiVersion: rbac.authorization.k8s.io/v1
kind: ClusterRoleBinding
metadata:
  name: admin-user
roleRef:
  apiGroup: rbac.authorization.k8s.io
  kind: ClusterRole
  name: cluster-admin
subjects:
- kind: ServiceAccount
  name: admin-user
  namespace: kube-system
save and exit the file
Next create service account by running following command
$ kubectl create -f k8s-dashboard-account.yaml
serviceaccount/admin-user created
clusterrolebinding.rbac.authorization.k8s.io/admin-user created
$
Now, generate the token for admin-user, run
$ kubectl -n kube-system create token admin-user
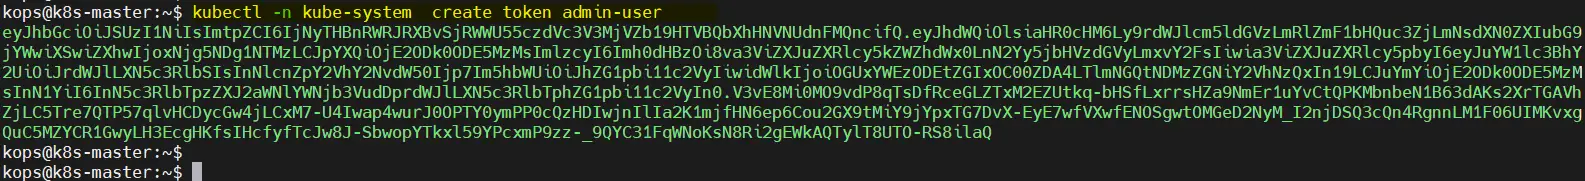
Copy this token and head back to browser, paste it on “Enter Token” field as shown below,
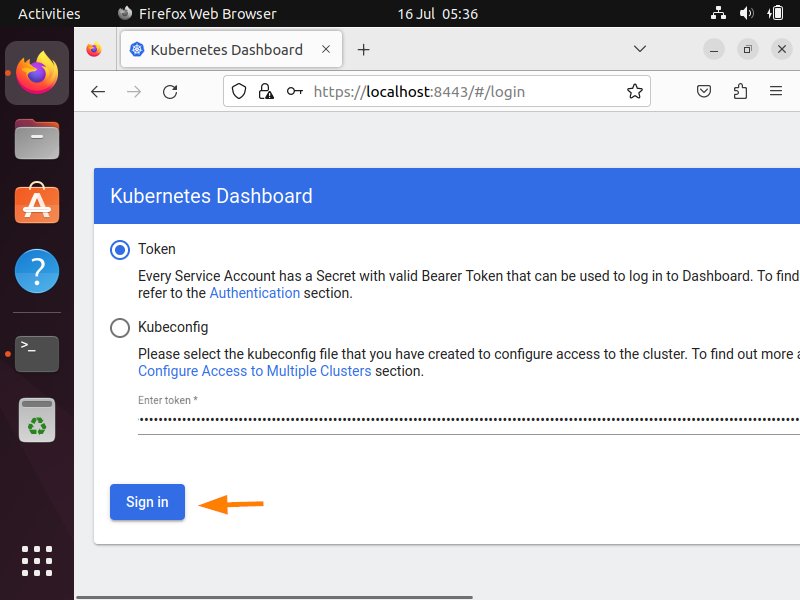
Click on “Sign in”
5) Access Kubernetes Dashboard
When we click on “Sign in” in above then we will get the following dashboard,
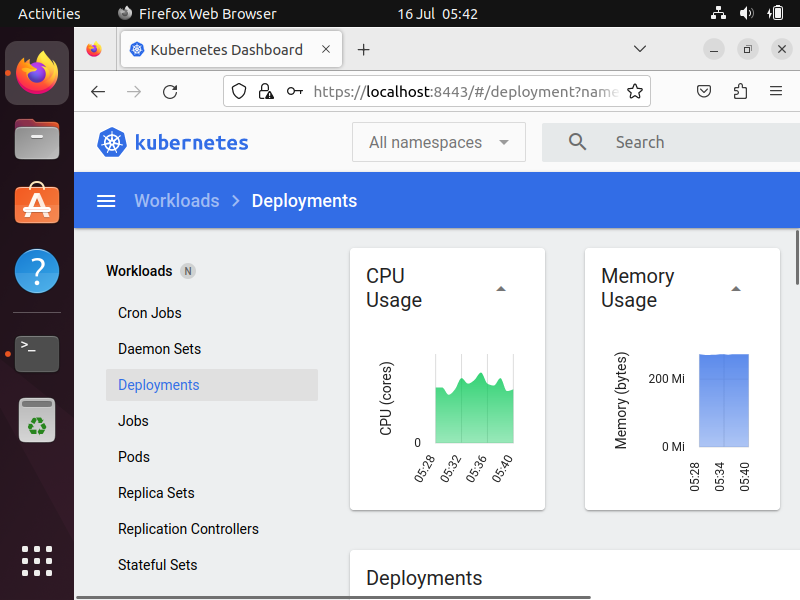
Great, you are now logged in to the Kubernetes Dashboard. Here are a few key features and functionalities to explore:
- Cluster Overview: Gain an overview of your cluster’s health, resource utilization, and running pods.
- Workloads: View and manage your deployments, replica sets, stateful sets, and daemon sets.
- Services: Monitor and manage your services, including load balancers and external endpoints.
- Configurations: Explore your config maps, secrets, and persistent volume claims.
- Storage: Manage persistent volumes and storage classes.
- Namespaces: Switch between namespaces to view and manage resources across different projects or teams.
That’s all from this post, I hope you have found it useful and informative. Kindly do post your queries and feedback in below comments section.