Being a Linux administrator is not an easy job. It takes lot of time, patience, and hard work to keep the systems up and running. But Linux System Admins can take some breather as they have some help in the form of command line monitoring tools. These tools help them to keep a tab on the Linux server performances and fix anything if found abnormal. In this article, we will look at the top 12 command line tools to monitor Linux performance.
1) Top
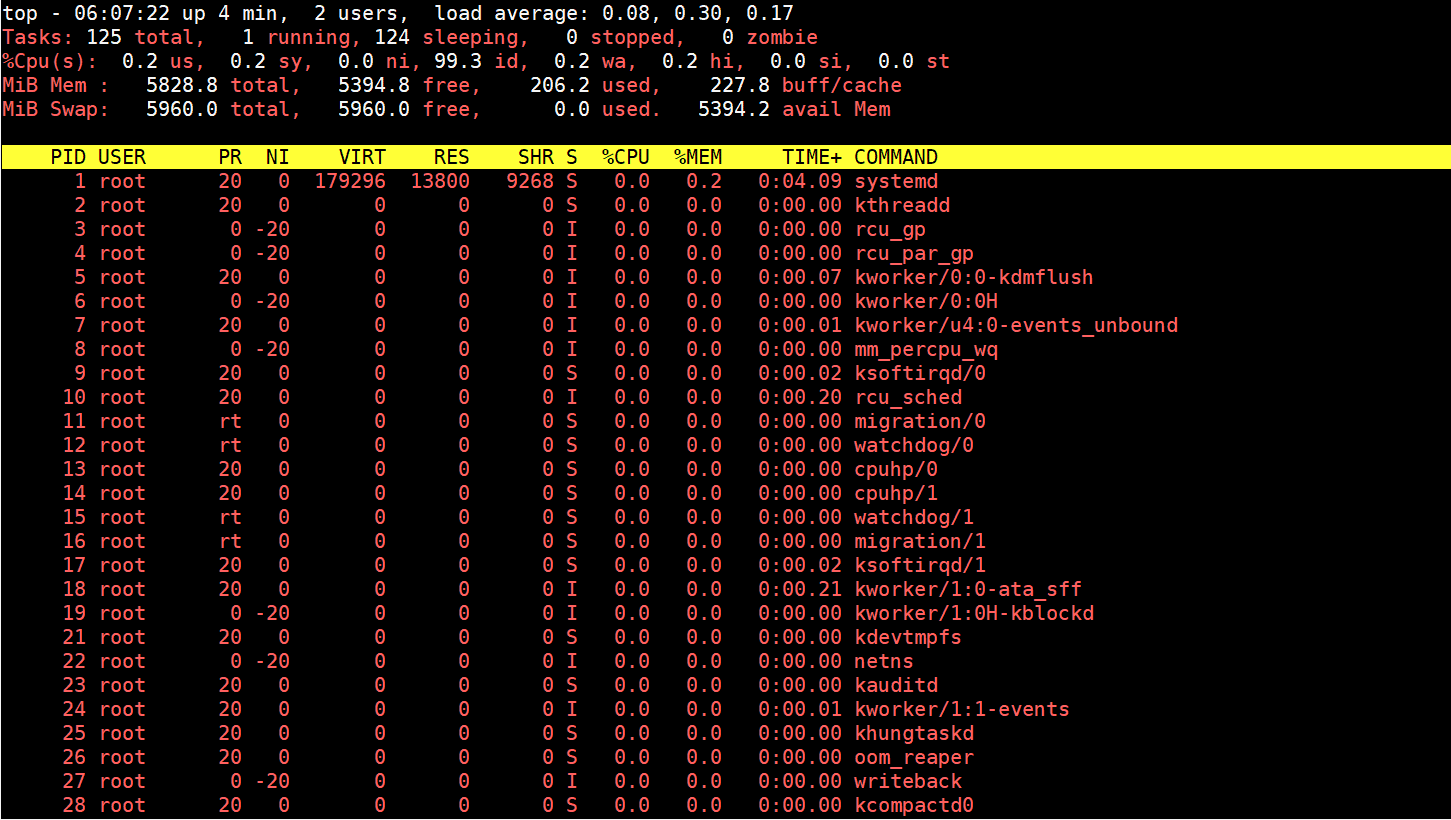
Without any doubt the top command is the number one command line tool to monitor Linux. It is one of the most widely used commands by Linux system administrators all over the world. It quickly provides details about all running processes in an ordered list. The list also keeps updating in real time. Not only the process names, it also displays the memory usage and CPU usage etc.
Also Read: 25 Top Command Examples to Monitor Linux Server Performance
2 ) vmstat
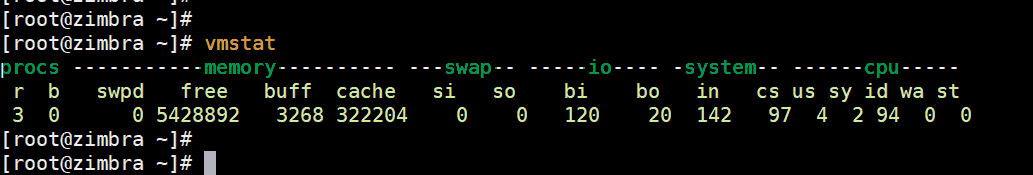
vmstst is the command line utility that occupies the 2nd position in our list. Its main task is used to display virtual memory statistics. It also helps you to display various information including all system processes, CPU activity, paging, block IO, kernel threads and disks etc. vmstat is the part of default installation in almost all the Linux distribution, so it is available straight way after the installation.
3) lsof
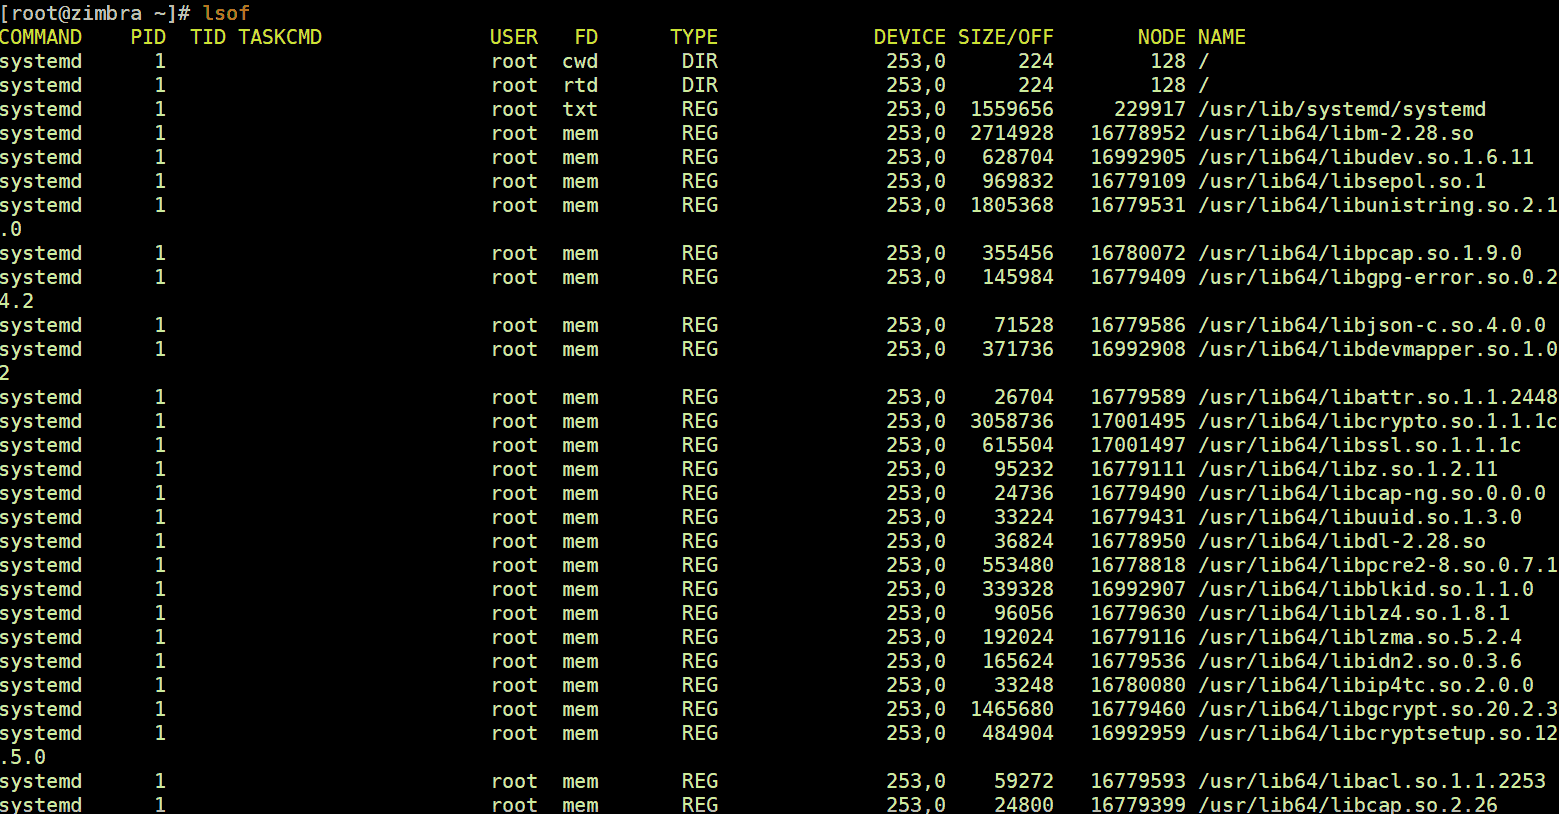
If you want to look at all the files currently opened in the system, then you need to make use of the lsof command. It is also used to monitor all processes currently in use. One of the major advantages of this command is that it helps administrators to see the files currently in use when a disk cannot be unmounted. Using this command, these files can be identified easily. lsof command is not available after the default Linux OS installation, so first we have to install it using following command:
For CentOS / RHEL
$ sudo yum install -y lsof              // CentOS 7 / RHEL 7 or before
$ sudo dnf install -y lsof              // CentOS 8 / RHEL 8
For Ubuntu / Debian
$ apt-get install -y lsof
Or
$ apt-get install -y lsof
To use lsof commmand, type lsof and hit enter
Also Read : 18 Quick ‘lsof’ command examples for Linux Geeks
4) tcpdump
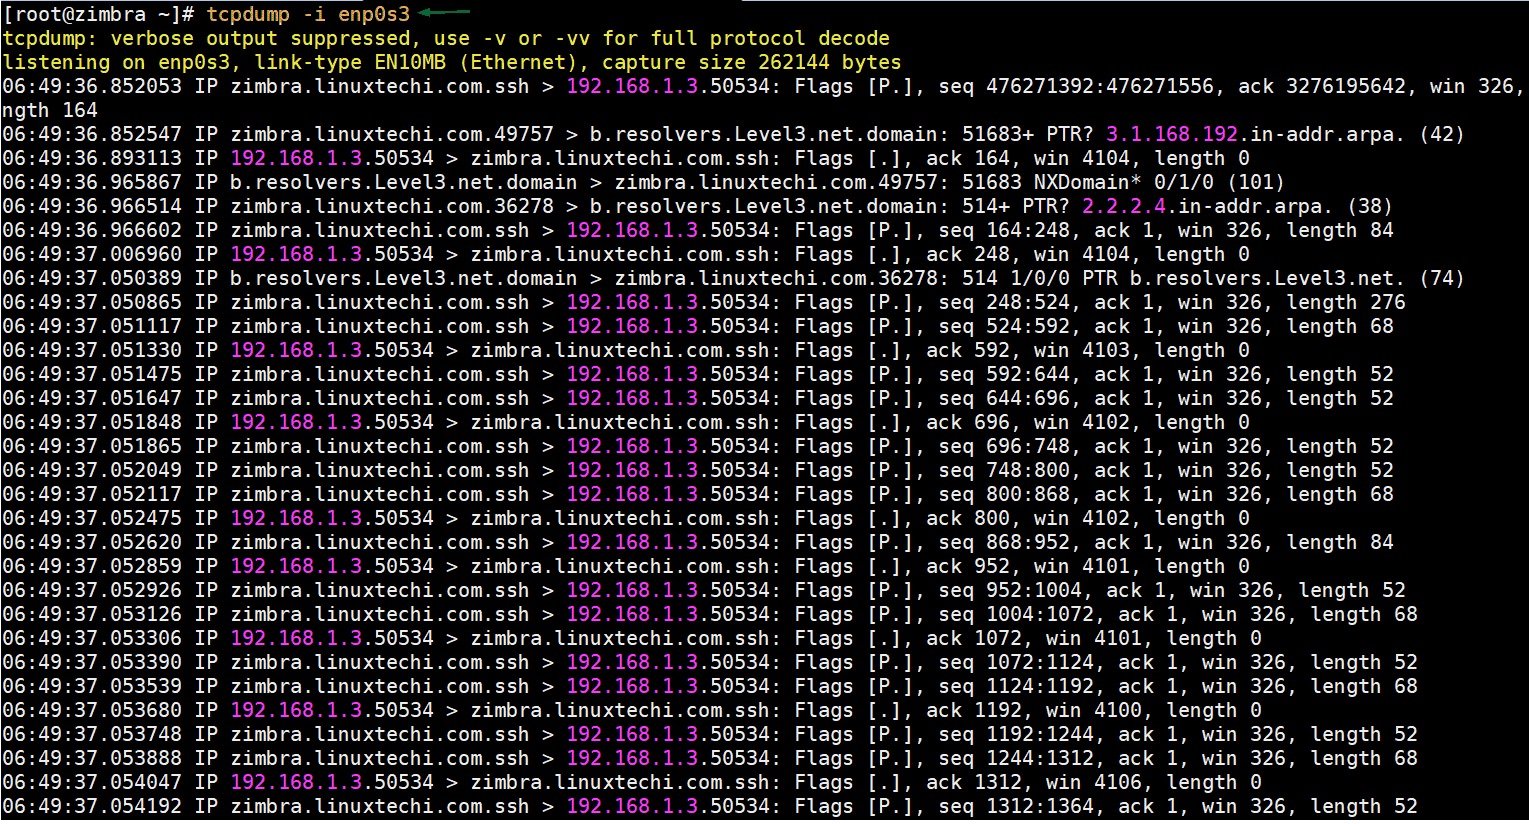
Tcpdump is another command line utility that allows Linux system administrators and network engineers to monitor all TCP/IP packets transferred over a network. Using tcpdump, one can also save all the packets in a separate file for analysis in the future.
Tcpdump is not part of default OS installation, so before start using it first install via following commands:
$ sudo yum install tcpdump -y    // CentOS 7 / RHEL 7 or before
$ sudo dnf install tcpdump -y    //CentOS 8 / RHEL 8
$ sudo apt install tcpdump -y    // Ubuntu / Debian
To Start capturing the packets on specific interface, run the following command,
# tcpdump -i enp0s3
Also Read: How to capture and analyze packets with tcpdump command on Linux
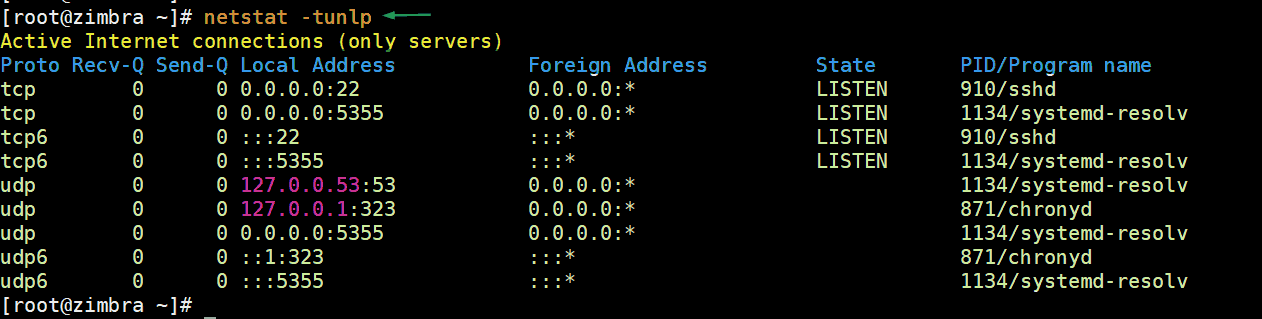
5) netstat
Netstat is one of the oldest command line utility used for network troubleshooting. Using netstat we can easily find network connections, routing tables, Ethernet card statistics and masquerade connections. In other words, we can say, it also helps you troubleshoot any network related issues quickly. In the latest Linux distributions, netstat is not the part of default installation. Use beneath command to install it on different Linux distributions.
For CentOS 8 / RHEL 8
$ sudo dnf install net-tools -y
For Ubuntu / Debian
$ sudo apt install -y net-tools
Run following command to list all tcp connections on your Linux system,
# netstat -tunlp
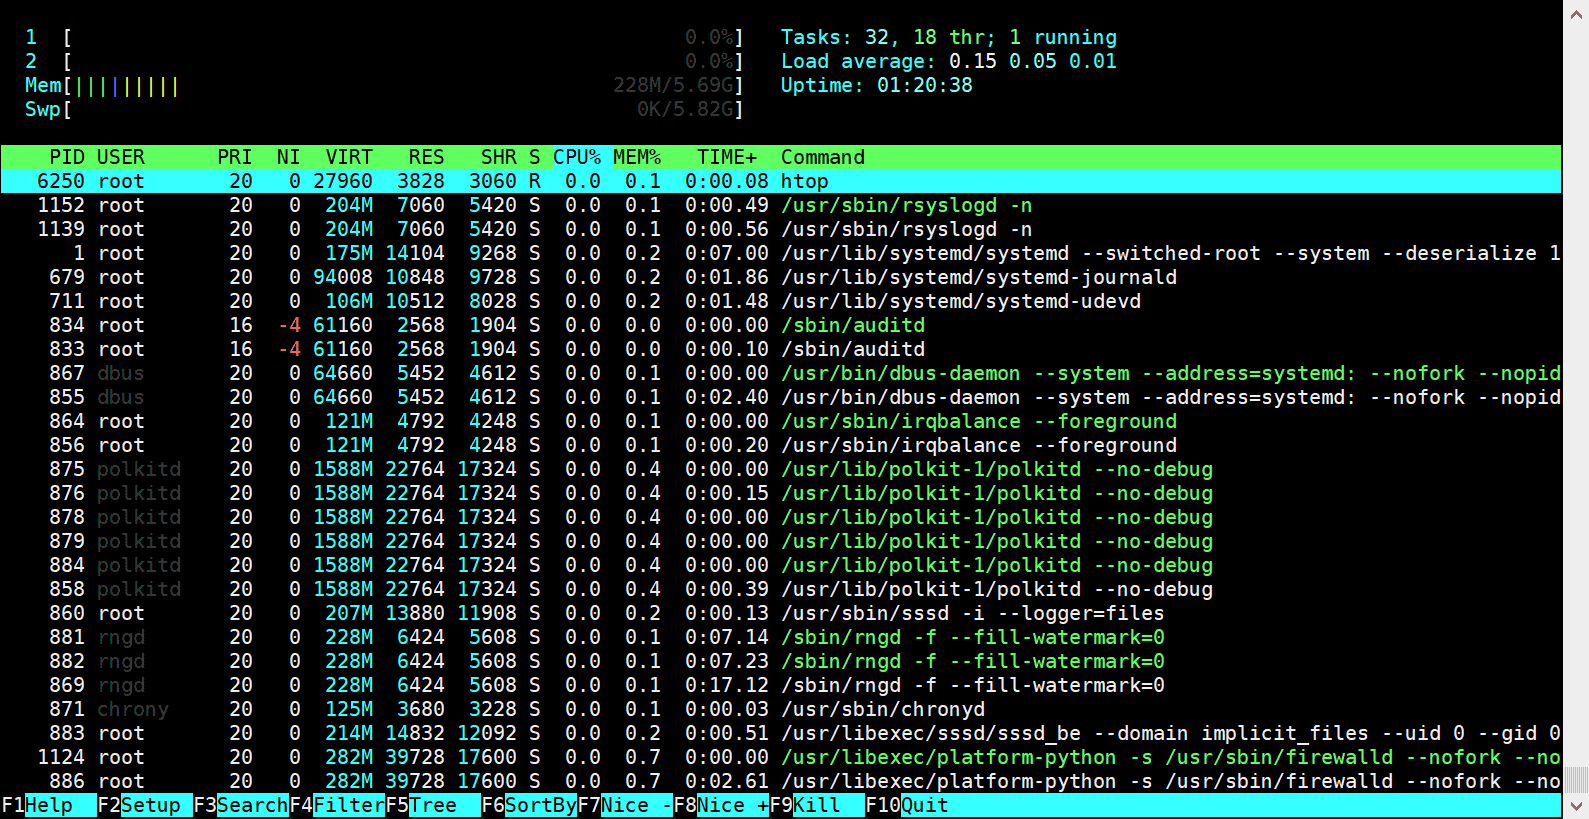
6) htop
htop command is another feature-rich command line utility that offers real-time monitoring of various vital resources in the Linux system. Compared to the top command, htop is a much-improvised version and even provides color coded output for easier understanding. It also supports both horizontal and vertical viewing and also allows administrators to manage processes as well.
To Install htop on Linux systems, execute following command,
$ sudo yum install -y htop              // CentOS 7 / RHEL 7 or before
$ sudo dnf install -y htop              // CentOS 8 / RHEL 8 or before
$ sudo apt install -y htop              // Ubuntu / Debian
Sample output of htop command:
$ htop
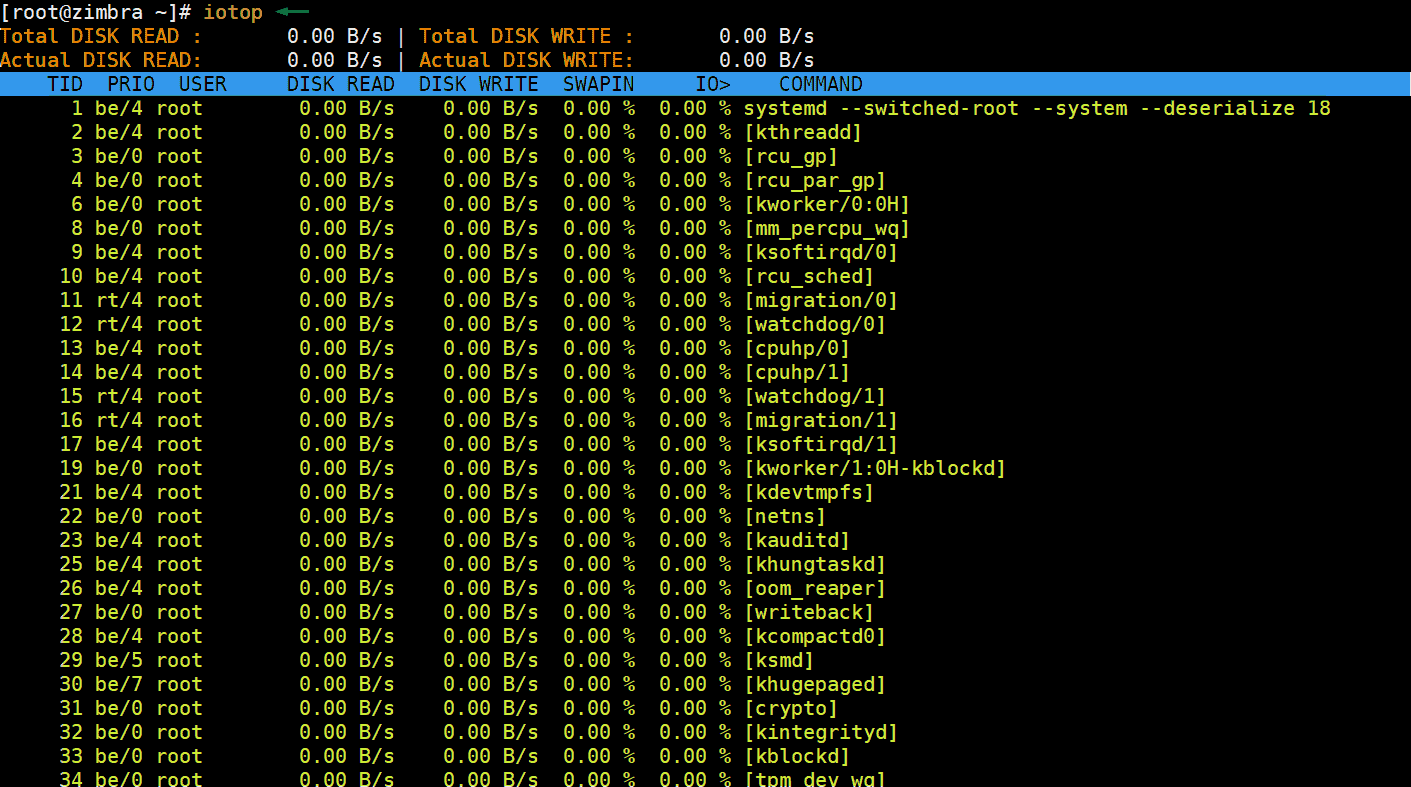
7) iotop
iotop is another free command line utility that allows admins to monitor disk I/O usage details. Even though it is similar to the top and htop command, one of the main advantages of iotop is that it provides a detail for a specific thread or a process in the system. Hence, system administrators can easily identify the process that is causing a lot of I/O rewrites to the server.
To Install iotop on different Linux distributions, run
$ sudo dnf install -y iotop    // CentOS 8 / RHEL 8
$ sudo yum install -y iotop    // CentOS 7 / RHEL 7
$ sudo apt install -y iotop    // Ubuntu / Debian
To start using iotop utility, type iotop on command line and hit enter,
$ iotop
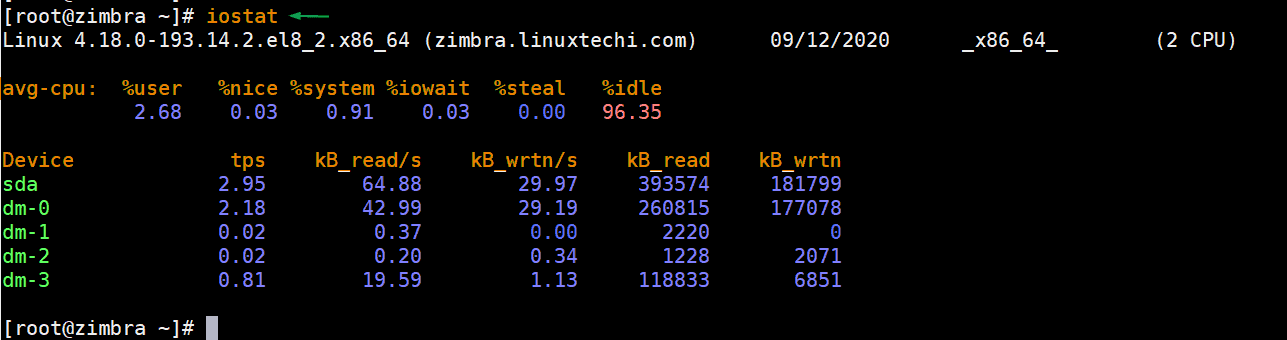
8) iostat
As the name suggests, iostat is a Linux command line tool that provides detailed statistics about the systems input/output for both devices and partitions. Linux system administrators can also use this command line tool to monitor the performance of both local and remote disks (NFS) as well.
Sample output of iostat is shown below:
$ iostat
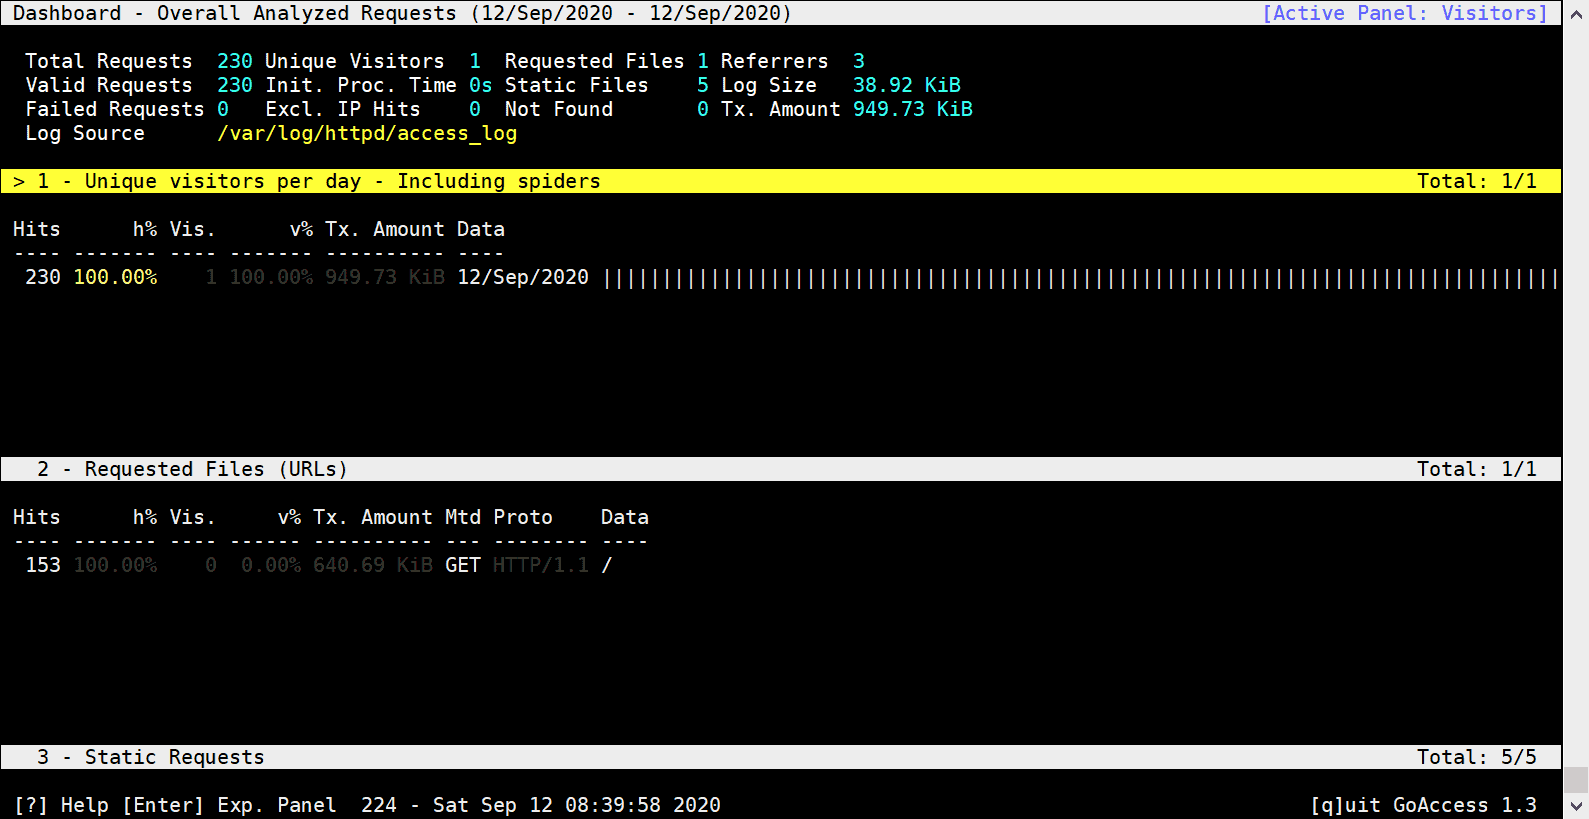
9) goaccess
Goaccess is an open-source real time log viewer and analyzer command line tool. It is available for almost all Linux distributions. It is can used to view real time logs for all web servers (Nginx , Apache, Amazon S3 and CloudFront etc).
Installation of Goaccess on CentOS 8 / RHEL 8
$ wget https://pkgs.dyn.su/el8/base/x86_64/goaccess-1.3-3.el8.x86_64.rpm
$ sudo dnf localinstall goaccess-1.3-3.el8.x86_64.rpm  -y
For Ubuntu / Debian
$ sudo apt get install goaccess
To analyze real time Apache web server’s log , run following goaccess command
$ sudo goaccess /var/log/httpd/access_log --log-format=COMBINED
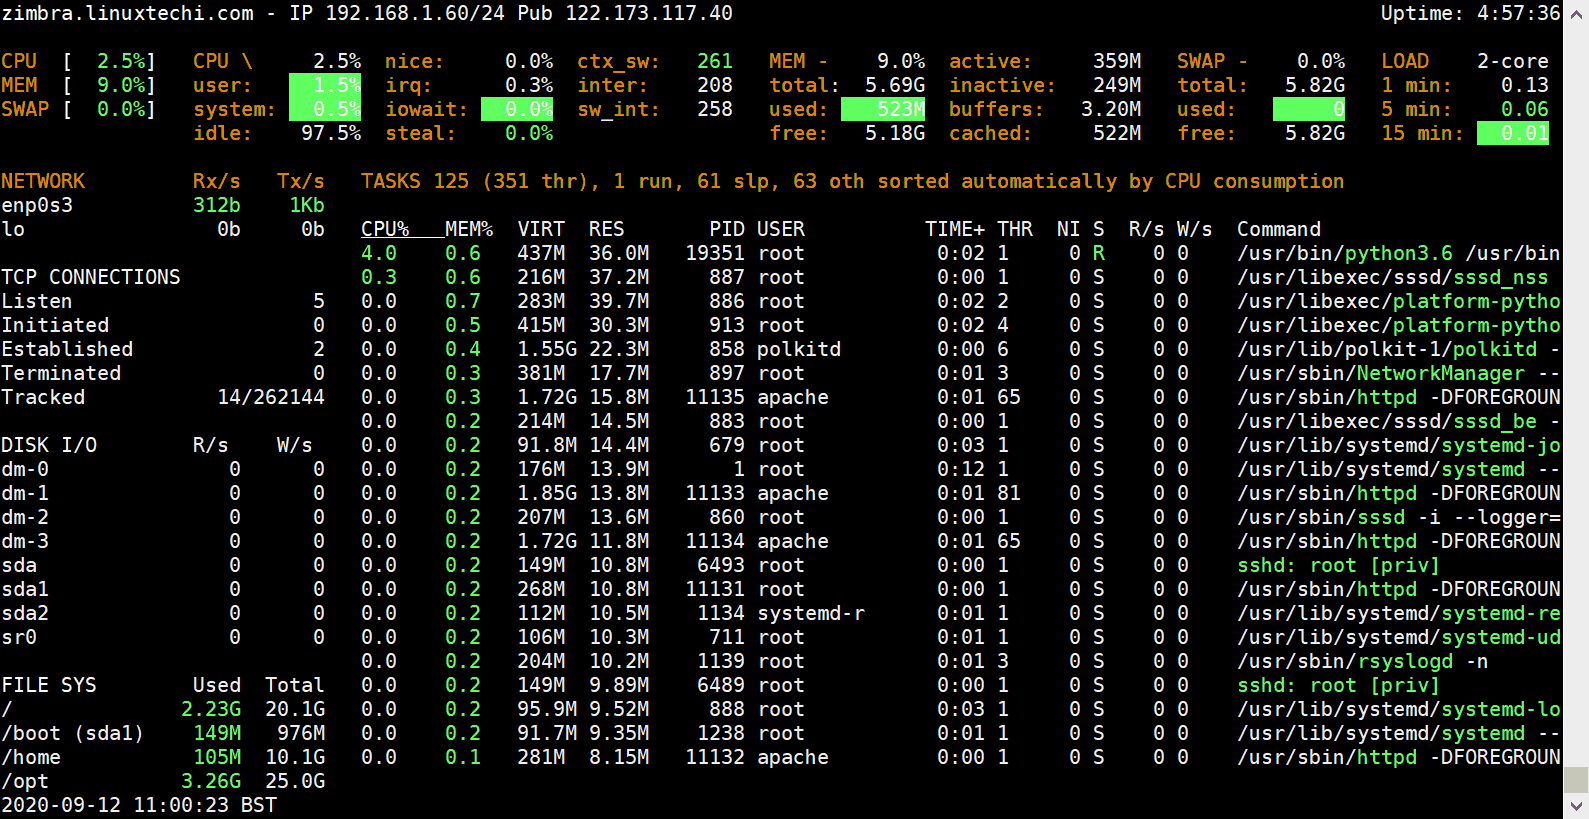
10) glances
Glances is a free and cross-platform command line tool to monitor linux system. Glances is available for almost all the Linux distributions and can collect system statistics apart from the monitoring. It is written in python and makes use of psutil library to retrieve useful information from the system. Glances can be used in three different ways:
- Standalone command line utility
- Client and Server
- Web Server
To Install glances on CentOS / RHEL system, run
$ sudo dnf install -y glances            // CentOS 8 / RHEL 8
$ sudo yum install -y glances            // CentOS 7 / RHEL 7
To Install Glances on Ubuntu / Debian system, run
$ sudo apt get install -y glances
To start using glances, type glances command,
$ glances
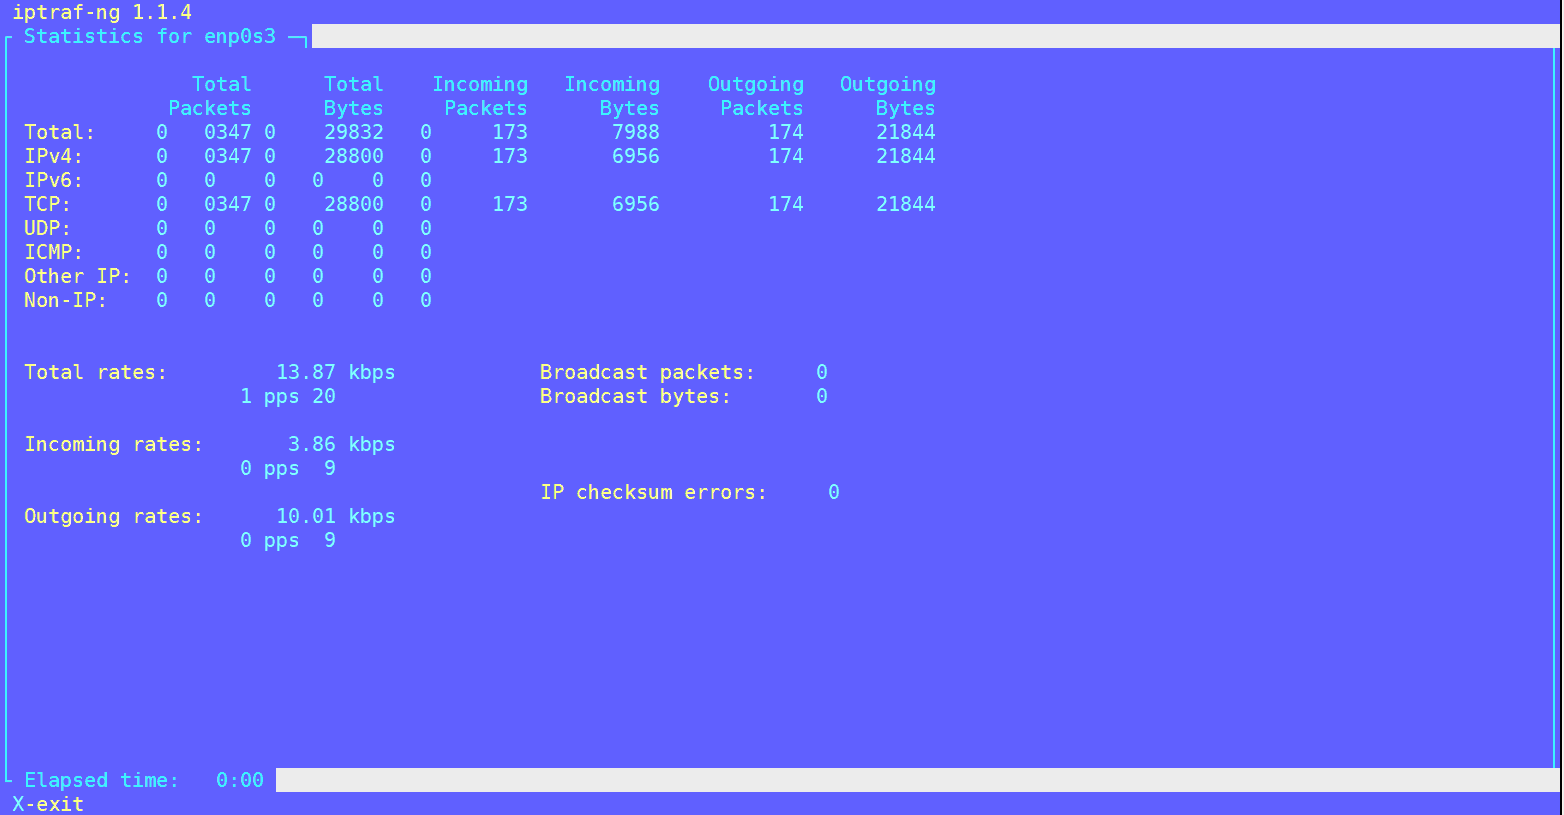
11) iptraf
Next in our list is iptraf, a command line utility that provides real time monitoring of Ethernet cards and networks. Using iptraf, system and network admins can gather a lot of details including:
- TCP traffic summary
- ICMP
- IP traffic
- UDP traffic
- Interface activity
- Statistical breakdowns
- Detailed interface statistics
Compared to other commands like iftop, we can say that iptraf provides a more detailed breakdown and statistics. Iptraf is not the part of default OS installation, so to install it run following command,
For CentOS / RHEL
$ sudo dnf install -y iptraf-ng
Or
$ sudo yum install -y iptraf-ng
For Ubuntu / Debian
$ sudo apt install -y iptraf-ng
To start iptraf utility, type iptraf-ng command and choose the ethernet card,
$ iptraf-ng
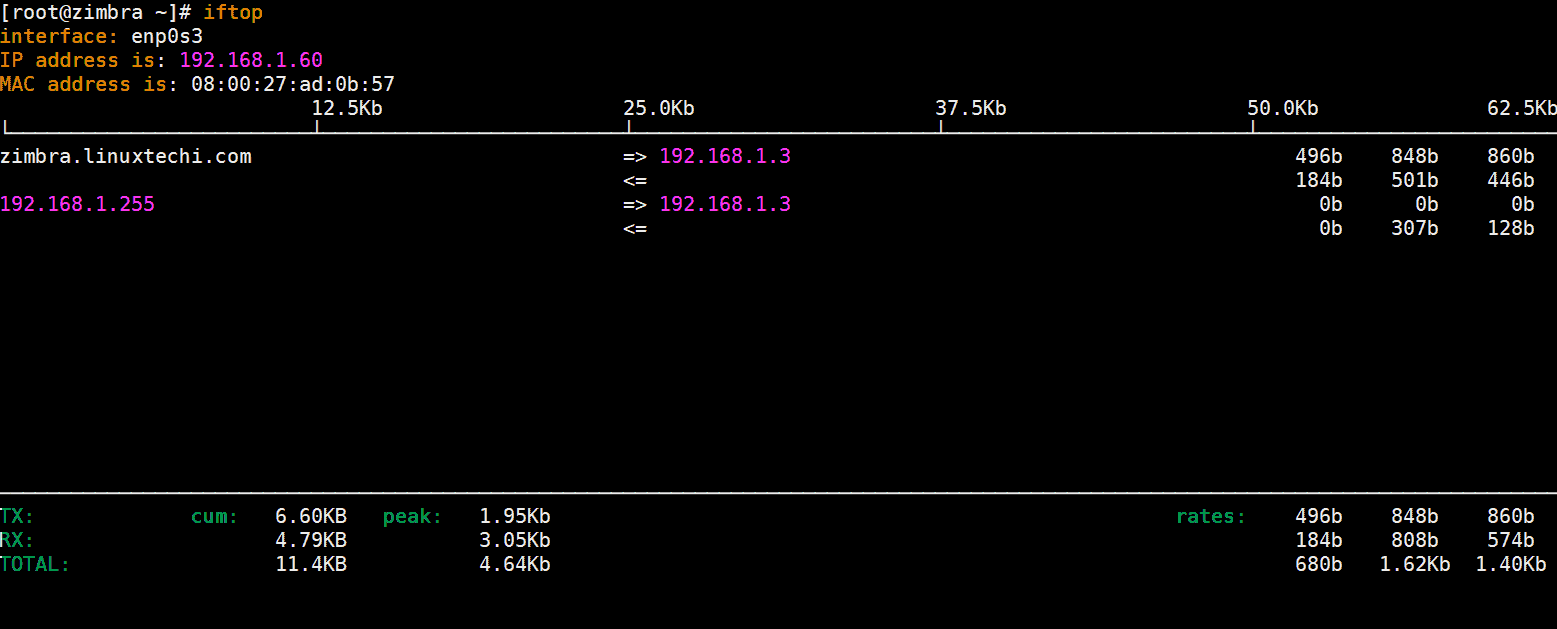
12) Iftop
The command line tool that occupies the 12th position in our list is the iftop tool. It is a simple command line tool that shows you bandwidth usage on the Ethernet cards of your Linux system. System and network admins use this tool for bandwidth monitoring. With iftop you can view both the source and destination in the first network interface it listens to.
To install iftop on CentOS / RHEL systems, run following command
$ sudo dnf install -y iftop
$ sudo yum install -y iftop
For Ubuntu / Debian systems, run
$ sudo apt install -y iftop
Type iftop to start this utility, example is shown below:
$ iftop
Read Also : 20 Awesome Nmap Command Examples in Linux
Nice Post. I was searching for it. I use top mostly.
I know the above is an oldish post but still relevant. Thanks. “Atop” along with “netatop” or “netatop-dkms” (Atop network kernel module, enables network statistics in atop) installed is pretty cool. ‘https://github.com/Atoptool/atop’
Cheers, nice post.
Nice Compilation