Elastic stack widely known as ELK stack, it is a group of opensource products like Elasticsearch, Logstash and Kibana. Elastic Stack is developed and maintained by Elastic company. Using elastic stack, one can feed system’s logs to Logstash, it is a data collection engine which accept the logs or data from all the sources and normalize logs and then it forwards the logs to Elasticsearch for analyzing, indexing, searching and storing and finally using Kibana one can represent the visualize data, using Kibana we can also create interactive graphs and diagram based on user’s queries.

In this article we will demonstrate how to setup multi node elastic stack (ELK Stack) cluster on RHEL 8 / CentOS 8 servers. Following are details for my Elastic Stack Cluster:
Elasticsearch:
- Three Servers with Minimal RHEL 8 / CentOS 8
- IPs & Hostname – 192.168.56.40 (elasticsearch1.linuxtechi. local), 192.168.56.50 (elasticsearch2.linuxtechi. local), 192.168.56.60 (elasticsearch3.linuxtechi. local)
Logstash:
- Two Servers with minimal RHEL 8 / CentOS 8
- IPs & Hostname – 192.168.56.20 (logstash1.linuxtechi. local) , 192.168.56.30 (logstash2.linuxtechi. local)
Kibana:
- One Server with minimal RHEL 8 / CentOS 8
- Hostname – kibana.linuxtechi.local
- IP – 192.168.56.10
Filebeat:
- One Server with minimal CentOS 7
- IP & hostname – 192.168.56.70 (web-server)
Let’s start with Elasticsearch cluster setup,
Setup 3 node Elasticsearch cluster
As I have already stated that I have kept nodes for Elasticsearch cluster, login to each node, set the hostname and configure yum/dnf repositories.
Use the below hostnamectl command to set the hostname on respective nodes,
[root@localhost ~]# hostnamectl set-hostname "elasticsearch1.linuxtechi. local"
[root@localhost ~]# exec bash
[root@elasticsearch1 ~]#
[root@localhost ~]# hostnamectl set-hostname "elasticsearch2.linuxtechi. local"
[root@localhost ~]# exec bash
[root@elasticsearch2 ~]#
[root@localhost ~]# hostnamectl set-hostname "elasticsearch3.linuxtechi. local"
[root@localhost ~]# exec bash
[root@elasticsearch3 ~]#
For CentOS 8 System we don’t need to configure any OS package repository and for RHEL 8 Server, if you have valid subscription and then subscribed it with Red Hat for getting package repository. In Case you want to configure local yum/dnf repository for OS packages then refer the below url:
How to Setup Local Yum/DNF Repository on RHEL 8 Server Using DVD or ISO File
Configure Elasticsearch package repository on all the nodes, create a file elastic.repo file under /etc/yum.repos.d/ folder with the following content
~]# vi /etc/yum.repos.d/elastic.repo
[elasticsearch-7.x]
name=Elasticsearch repository for 7.x packages
baseurl=https://artifacts.elastic.co/packages/7.x/yum
gpgcheck=1
gpgkey=https://artifacts.elastic.co/GPG-KEY-elasticsearch
enabled=1
autorefresh=1
type=rpm-md
save & exit the file
Use below rpm command on all three nodes to import Elastic’s public signing key
~]# rpm --import https://artifacts.elastic.co/GPG-KEY-elasticsearch
Add the following lines in /etc/hosts file on all three nodes,
192.168.56.40             elasticsearch1.linuxtechi.local
192.168.56.50             elasticsearch2.linuxtechi.local
192.168.56.60             elasticsearch3.linuxtechi.local
Install Java on all three Nodes using yum / dnf command,
[root@elasticsearch1 ~]# dnf install java-openjdk -y
[root@elasticsearch2 ~]# dnf install java-openjdk -y
[root@elasticsearch3 ~]# dnf install java-openjdk -y
Install Elasticsearch using beneath dnf command on all three nodes,
[root@elasticsearch1 ~]# dnf install elasticsearch -y
[root@elasticsearch2 ~]# dnf install elasticsearch -y
[root@elasticsearch3 ~]# dnf install elasticsearch -y
Note: In case OS firewall is enabled and running in each Elasticsearch node then allow following ports using beneath firewall-cmd command,
~]# firewall-cmd --permanent --add-port=9300/tcp
~]# firewall-cmd --permanent --add-port=9200/tcp
~]# firewall-cmd --reload
Configure Elasticsearch, edit the file “/etc/elasticsearch/elasticsearch.yml” on all the three nodes and add the followings,
~]# vim /etc/elasticsearch/elasticsearch.yml
…………………………………………
cluster.name: opn-cluster
node.name: elasticsearch1.linuxtechi.local
network.host: 192.168.56.40
http.port: 9200
discovery.seed_hosts: ["elasticsearch1.linuxtechi.local", "elasticsearch2.linuxtechi.local", "elasticsearch3.linuxtechi.local"]
cluster.initial_master_nodes: ["elasticsearch1.linuxtechi.local", "elasticsearch2.linuxtechi.local", "elasticsearch3.linuxtechi.local"]
……………………………………………
Note: on Each node, add the correct hostname in node.name parameter and ip address in network.host parameter and other parameters will remain the same.
Now Start and enable the Elasticsearch service on all three nodes using following systemctl command,
~]# systemctl daemon-reload
~]# systemctl enable elasticsearch.service
~]# systemctl start elasticsearch.service
Use below ‘ss’ command to verify whether elasticsearch node is start listening on 9200 port,
[root@elasticsearch1 ~]# ss -tunlp | grep 9200
tcp   LISTEN  0       128       [::ffff:192.168.56.40]:9200              *:*     users:(("java",pid=2734,fd=256))
[root@elasticsearch1 ~]#
Use following curl commands to verify the Elasticsearch cluster status
[root@elasticsearch1 ~]# curl  http://elasticsearch1.linuxtechi.local:9200
[root@elasticsearch1 ~]# curl -X GET  http://elasticsearch2.linuxtechi.local:9200/_cluster/health?pretty
Output above command would be something like below,
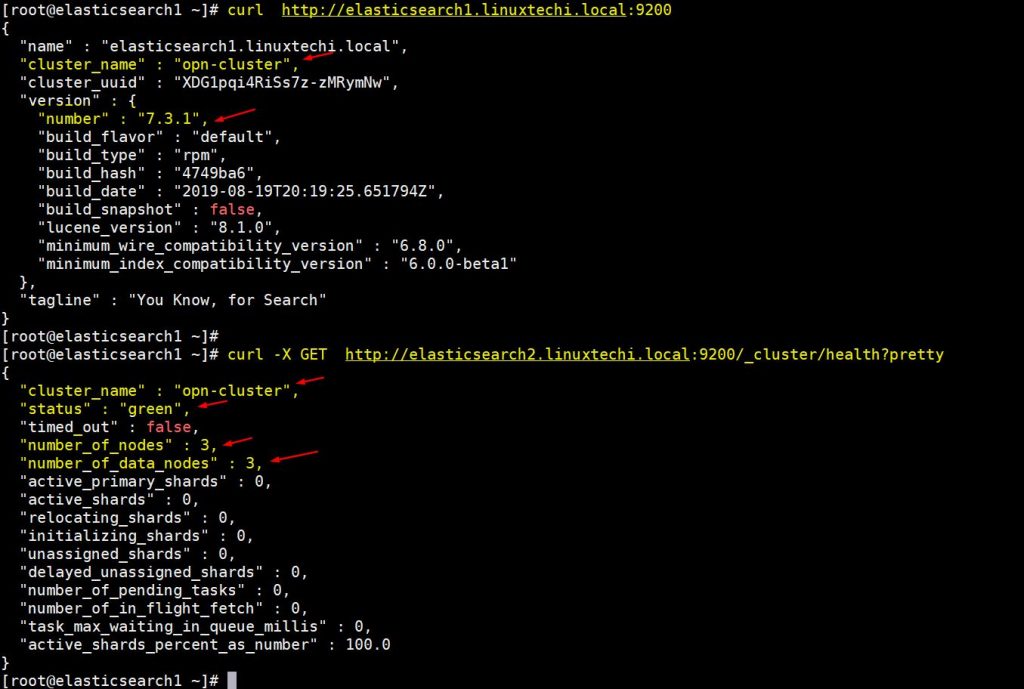
Above output confirms that we have successfully created 3 node Elasticsearch cluster and status of cluster is also green.
Note: If you want to modify JVM heap size then you have edit the file “/etc/elasticsearch/jvm.options” and change the below parameters that suits to your environment,
- -Xms1g
- -Xmx1g
Now let’s move to Logstash nodes,
Install and Configure Logstash
Perform the following steps on both Logstash nodes,
Login to both the nodes set the hostname using following hostnamectl command,
[root@localhost ~]# hostnamectl set-hostname "logstash1.linuxtechi.local"
[root@localhost ~]# exec bash
[root@logstash1 ~]#
[root@localhost ~]# hostnamectl set-hostname "logstash2.linuxtechi.local"
[root@localhost ~]# exec bash
[root@logstash2 ~]#
Add the following entries in /etc/hosts file in both logstash nodes
~]# vi /etc/hosts
192.168.56.40             elasticsearch1.linuxtechi.local
192.168.56.50             elasticsearch2.linuxtechi.local
192.168.56.60             elasticsearch3.linuxtechi.local
Save and exit the file
Configure Logstash repository on both the nodes, create a file logstash.repo under the folder /ete/yum.repos.d/ with following content,
~]# vi /etc/yum.repos.d/logstash.repo
[elasticsearch-7.x]
name=Elasticsearch repository for 7.x packages
baseurl=https://artifacts.elastic.co/packages/7.x/yum
gpgcheck=1
gpgkey=https://artifacts.elastic.co/GPG-KEY-elasticsearch
enabled=1
autorefresh=1
type=rpm-md
Save and exit the file, run the following rpm command to import the signing key
~]# rpm --import https://artifacts.elastic.co/GPG-KEY-elasticsearch
Install Java OpenJDK on both the nodes using following dnf command,
~]# dnf install java-openjdk -y
Run the following dnf command from both the nodes to install logstash,
[root@logstash1 ~]# dnf install logstash -y
[root@logstash2 ~]# dnf install logstash -y
Now configure logstash, perform below steps on both logstash nodes,
Create a logstash conf file, for that first we have copy sample logstash file under ‘/etc/logstash/conf.d/’
# cd /etc/logstash/
# cp logstash-sample.conf conf.d/logstash.conf
Edit conf file and update the following content,
# vi conf.d/logstash.conf

input {
  beats {
    port => 5044
  }
}

output {
  elasticsearch {
    hosts => ["http://elasticsearch1.linuxtechi.local:9200", "http://elasticsearch2.linuxtechi.local:9200", "http://elasticsearch3.linuxtechi.local:9200"]
    index => "%{[@metadata][beat]}-%{[@metadata][version]}-%{+YYYY.MM.dd}"
    #user => "elastic"
    #password => "changeme"
  }
}
Under output section, in hosts parameter specify FQDN of all three Elasticsearch nodes, other parameters leave as it is.
Allow logstash port “5044” in OS firewall using following firewall-cmd command,
~ # firewall-cmd --permanent --add-port=5044/tcp
~ # firewall-cmd –reload
Now start and enable Logstash service, run the following systemctl commands on both the nodes
~]# systemctl start logstash
~]# systemctl eanble logstash
Use below ss command to verify whether logstash service start listening on 5044,
[root@logstash1 ~]# ss -tunlp | grep 5044
tcp   LISTEN  0       128                         *:5044                *:*      users:(("java",pid=2416,fd=96))
[root@logstash1 ~]#
Above output confirms that logstash has been installed and configured successfully. Let’s move to Kibana installation.
Install and Configure Kibana
Login to Kibana node, set the hostname with hostnamectl command,
[root@localhost ~]# hostnamectl set-hostname "kibana.linuxtechi.local"
[root@localhost ~]# exec bash
[root@kibana ~]#
Edit /etc/hosts file and add the following lines
192.168.56.40             elasticsearch1.linuxtechi.local
192.168.56.50             elasticsearch2.linuxtechi.local
192.168.56.60             elasticsearch3.linuxtechi.local
Setup the Kibana repository using following,
[root@kibana ~]# vi /etc/yum.repos.d/kibana.repo
[elasticsearch-7.x]
name=Elasticsearch repository for 7.x packages
baseurl=https://artifacts.elastic.co/packages/7.x/yum
gpgcheck=1
gpgkey=https://artifacts.elastic.co/GPG-KEY-elasticsearch
enabled=1
autorefresh=1
type=rpm-md

[root@kibana ~]# rpm --import https://artifacts.elastic.co/GPG-KEY-elasticsearch
Execute below dnf command to install kibana,
[root@kibana ~]# yum install kibana -y
Configure Kibana by editing the file “/etc/kibana/kibana.yml”
[root@kibana ~]# vim /etc/kibana/kibana.yml
…………
server.host: "kibana.linuxtechi.local"
server.name: "kibana.linuxtechi.local"
elasticsearch.hosts: ["http://elasticsearch1.linuxtechi.local:9200", "http://elasticsearch2.linuxtechi.local:9200", "http://elasticsearch3.linuxtechi.local:9200"]
…………
Start and enable kibana service
[root@kibana ~]# systemctl start kibana
[root@kibana ~]# systemctl enable kibana
Allow Kibana port ‘5601’ in OS firewall,
[root@kibana ~]# firewall-cmd --permanent --add-port=5601/tcp
success
[root@kibana ~]# firewall-cmd --reload
success
[root@kibana ~]#
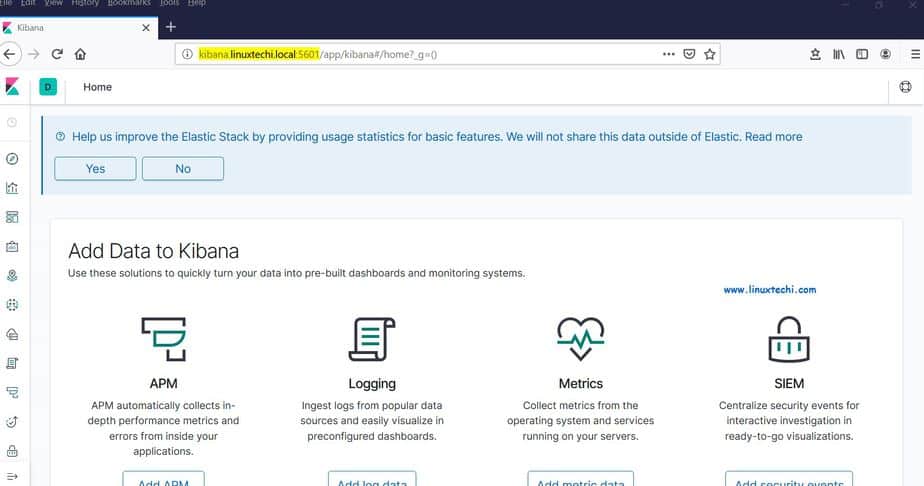
Access Kibana portal / GUI using the following URL:
http://kibana.linuxtechi.local:5601
From dashboard, we can also check our Elastic Stack cluster status
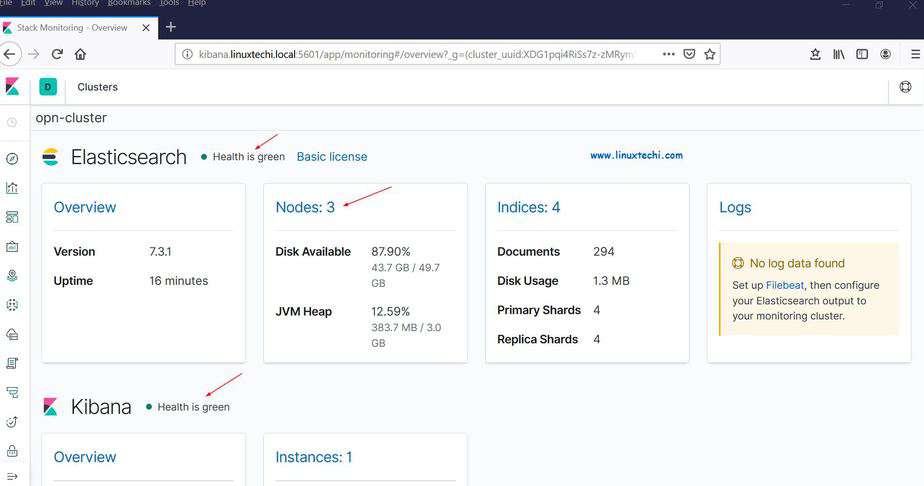
This confirms that we have successfully setup multi node Elastic Stack cluster on RHEL 8 / CentOS 8.
Now let’s send some logs to logstash nodes via filebeat from other Linux servers, In my case I have one CentOS 7 Server, I will push all important logs of this server to logstash via filebeat.
Login to CentOS 7 server and install filebeat package using following rpm command,
[root@web-server ~]# rpm -ivh https://artifacts.elastic.co/downloads/beats/filebeat/filebeat-7.3.1-x86_64.rpm
Retrieving https://artifacts.elastic.co/downloads/beats/filebeat/filebeat-7.3.1-x86_64.rpm
Preparing...                          ################################# [100%]
Updating / installing...
   1:filebeat-7.3.1-1                 ################################# [100%]
[root@web-server ~]#
Edit the /etc/hosts file and add the following entries,
192.168.56.20             logstash1.linuxtechi.local
192.168.56.30             logstash2.linuxtechi.local
Now configure the filebeat so that it can send logs to logstash nodes using load balancing technique, edit the file “/etc/filebeat/filebeat.yml” and add the following parameters,
Under the ‘filebeat.inputs:’ section change ‘enabled: false‘ to ‘enabled: true‘ and under the “paths” parameter specify the location log files that we can send to logstash, In output Elasticsearch section comment out “output.elasticsearch” and host parameter. In Logstash output section, remove the comments for “output.logstash:” and “hosts:” and add the both logstash nodes in hosts parameters and also “loadbalance: true”.
[root@web-server ~]# vi /etc/filebeat/filebeat.yml
……………………….
filebeat.inputs:
- type: log
  enabled: true
  paths:
    - /var/log/messages
    - /var/log/dmesg
    - /var/log/maillog
    - /var/log/boot.log
#output.elasticsearch:
  #  hosts: ["localhost:9200"]

output.logstash:
    hosts: ["logstash1.linuxtechi.local:5044", "logstash2.linuxtechi.local:5044"]
    loadbalance: true
………………………………………
Start and enable filebeat service using beneath systemctl commands,
[root@web-server ~]# systemctl start filebeat
[root@web-server ~]# systemctl enable  filebeat
Now go to Kibana GUI, verify whether new indices are visible or not,
Choose Management option from Left side bar and then click on Index Management under Elasticsearch,
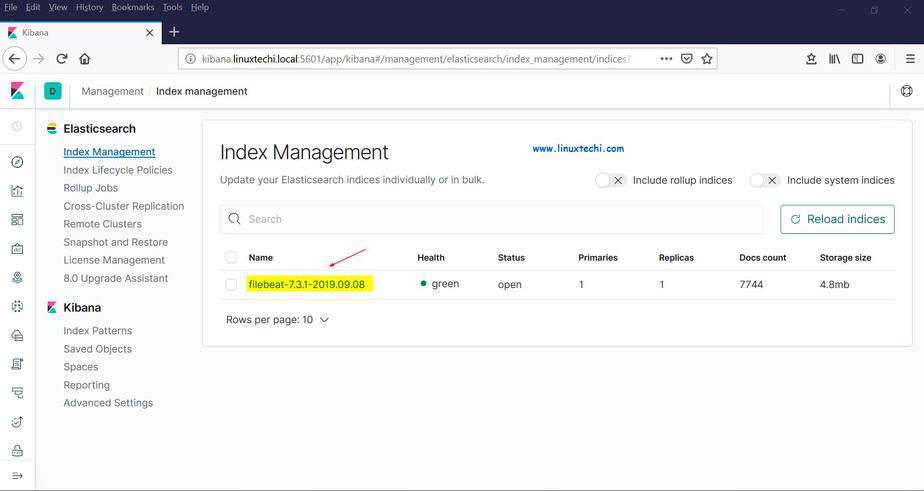
As we can see above, indices are visible now, let’s create index pattern,
Click on “Index Patterns” from Kibana Section, it will prompt us to create a new pattern, click on “Create Index Pattern” and specify the pattern name as “filebeat”
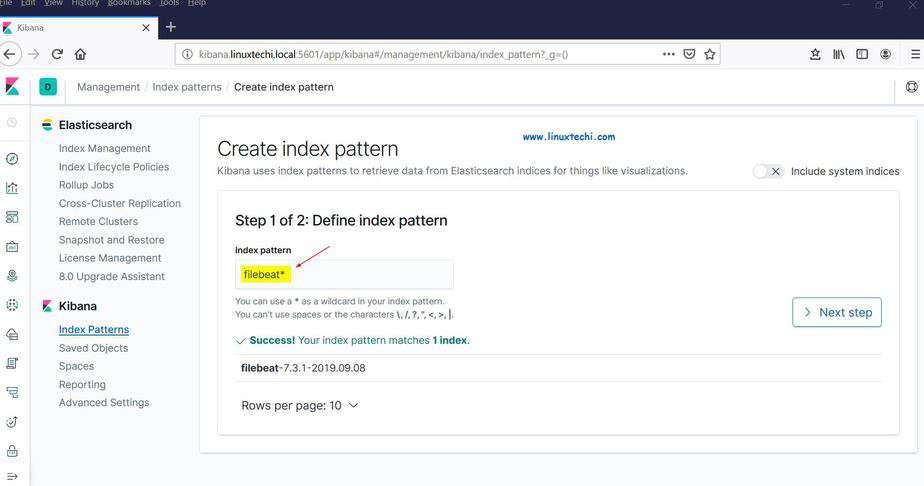
Click on Next Step
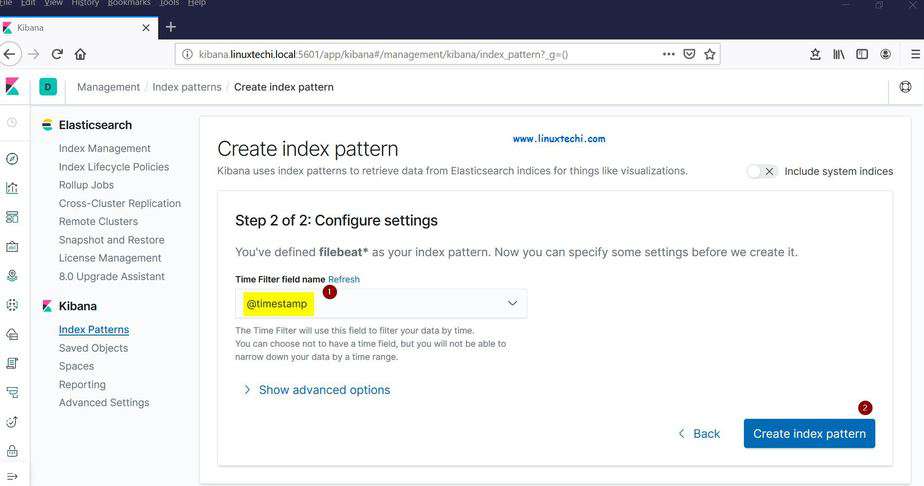
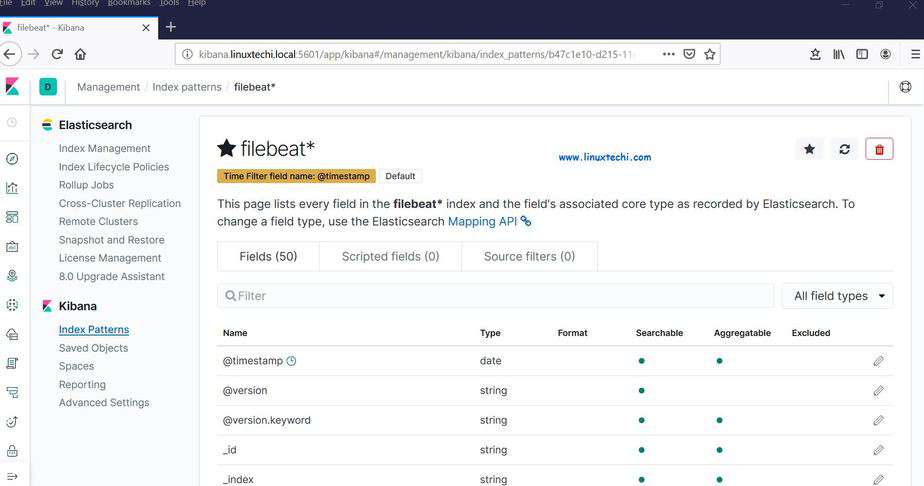
Choose “Timestamp” as time filter for index pattern and then click on “Create index pattern”
Now Click on Discover to see real time filebeat index pattern,
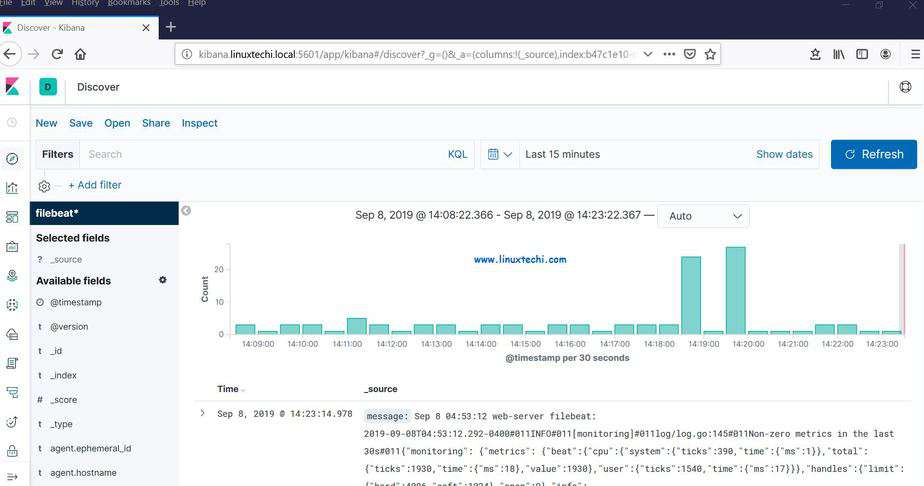
This confirms that Filebeat agent has been configured successfully and we are able to see real time logs on Kibana dashboard.
That’s all from this article, please don’t hesitate to share your feedback and comments in case these steps help you to setup multi node Elastic Stack Cluster on RHEL 8 / CentOS 8 system.


How about if i will use the elasticsearch-certutil cert do i need to do it in all the nodes? Also the elasticsearch-setup-passwords auto should i run this to all of the machine nodes?
Thanks for the tut. On installinf the elasticsearch, I cannot get the systemctl to start. What must be the status of SELinux be like when installing this??
Hi there very nice tutorial , and everything working
But , to me is not appearing first page when l access kibana, no dashboard , how did you make dashboard working ?
Best regards
Thanks for the detailed article. I did this setup in CentOS7 and it is perfectly fine.
Thank you for the perfect multi-node ELK stack.
If possible, please create same Graylog Multi-node setup tutorial.
Thank you for this tutorial. Can you please make tutorial for securing cluster? Kind like ssl verifications kibanaa users and etc