In this post, we will cover to how to install Kubernetes metrics server step by step.
The Kubernetes(k8s) Metrics Server is a component that collects and aggregates metrics data from various sources in the Kubernetes cluster, including nodes and pods. This data can be used to monitor and optimize resource utilization, identify potential issues, and improve the overall performance of your Kubernetes cluster.
Metrics Server collects resource utilization data such as CPU and memory usage for nodes and pods in the cluster. It provides an API endpoint that can be used to query this data and retrieve metrics for specific resources in the cluster.
Prerequisites
- A Kubernetes cluster (v1.21 or high) up and running.
- kubectl command line tool installed and configured to interact to your Kubernetes cluster.
- The ability to create and modify Kubernetes objects.
Without any further delay, let’s deep dive into the installation steps.
Step 1) Download Metrics Server Manifest
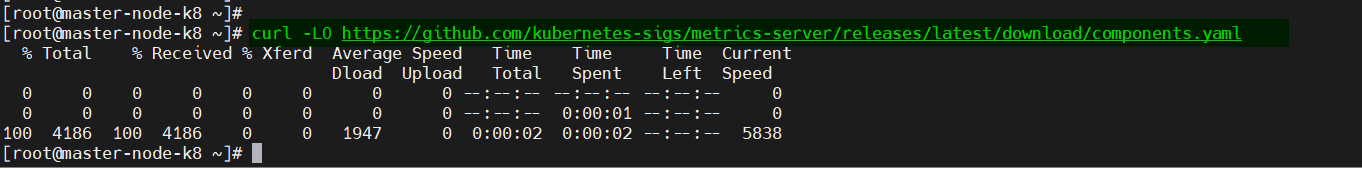
The first step is to download the latest Metrics Server manifest file from the Kubernetes GitHub repository. Use below curl command to download yaml file,
# curl -LO https://github.com/kubernetes-sigs/metrics-server/releases/latest/download/components.yaml
If you are planning to install metrics server in high availability mode then download following manifest file.
# curl https://github.com/kubernetes-sigs/metrics-server/releases/latest/download/high-availability-1.21+.yaml
Step 2) Modify Metrics Server Yaml File
Next, you need to modify the Metrics Server yaml file to set some configuration options,
# vi components.yaml
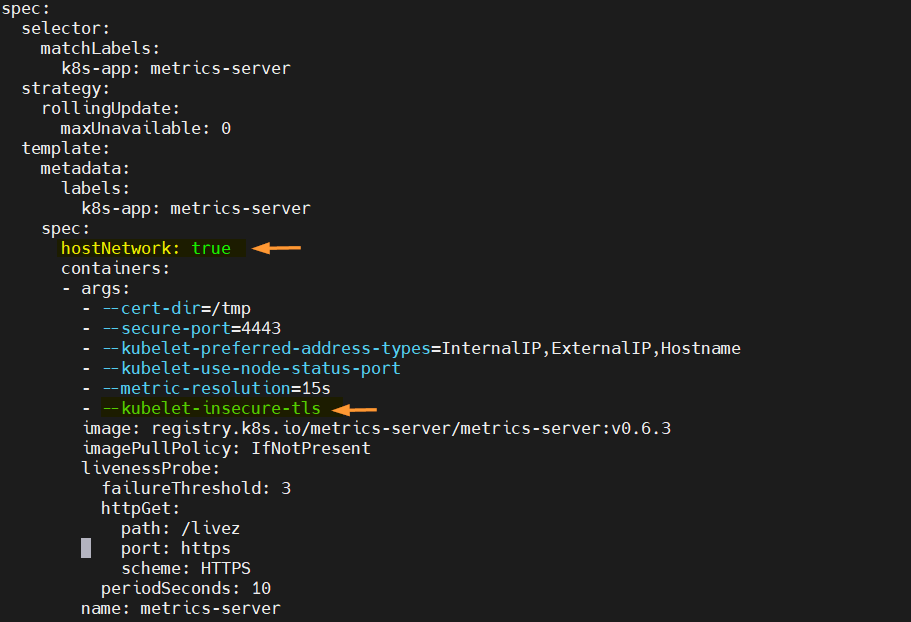
Find the args section under the container section, add the following line:
- --kubelet-insecure-tls
Under the spec section, add following parameter,
hostNetwork: true
Save and close the file.
Step 3) Deploy Metrics Server
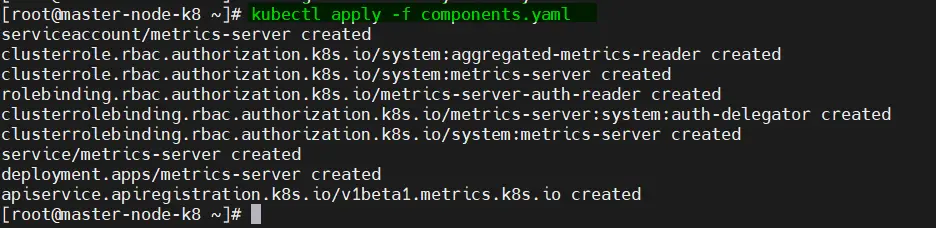
Now, we are all set to deploy metrics server, run following kubectl command,
# kubectl apply -f components.yaml
Step 4) Verify Metrics Server Deployment
After deploying the Metrics Server, verify it’s status by checking the pods status which is running in the kube-system namespace,
# kubectl get pods -n kube-system
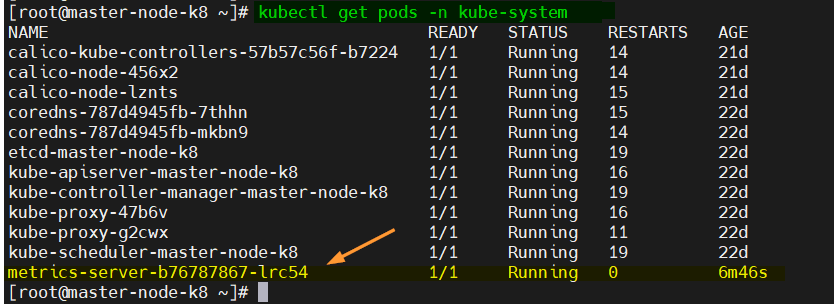
Output above confirms that metrics-server pod is up and running.
Step 5) Test Metrics Server Installation
Finally, you can test the metrics server by running following kubectl command,
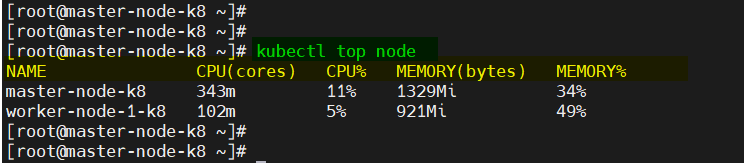
# kubectl top nodes
This command should display the resource utilization for each node in your cluster, including CPU and memory usage.
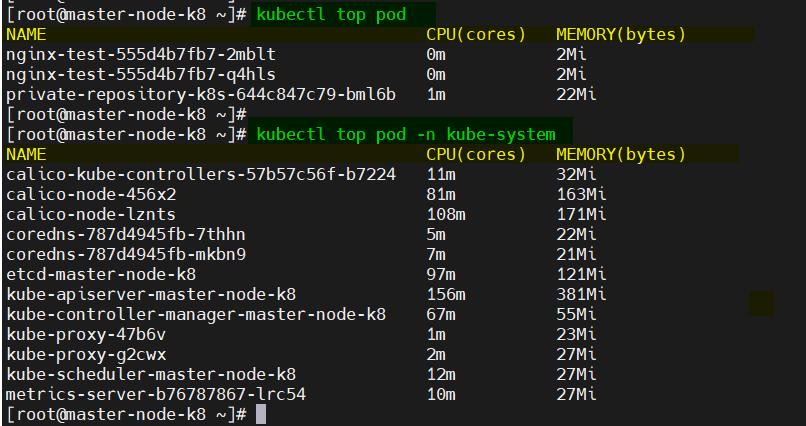
To view pods resource utilization of your current namespace or specific namespace, run
# kubectl top pod
# kubectl top pod -n kube-system
That’s all from this post, I have hope you found it informative. Please do post your feedback and queries in below comments section.
Also Read: How to Install and Use Helm in Kubernetes

Really helpful.
Precise and steightforward.
Thank you.
PERFECT user guide.
thanks!
Perfect. Works fine on my self hosted kubernetes running on Ubuntu 22.04.
Even this command “kubectl get pods -n kube-system” shows metrics-server as Ready, but it is still showing “error: Metrics API not available”