In this guide, we will discuss how to generate CPU, memory and I/O report using sar command in linux.
SAR stands for System Activity Report, as its name suggest, sar command is used to collect, report & save CPU, Memory, I/O usage in Unix/Linux like operating systems. SAR command generate the reports on the fly and can also save the reports in log files as well.
Note: In case, sar is not installed on your linux system then use beneath steps,
Install SAR on RHEL / Rocky Linux / AlmaLinux
$ sudo dnf install sysstat -y
Install SAR on Ubuntu 22.04 / 24.04
$ sudo apt update
$ sudo apt install -y sysstat
Start the sadc (system activity data collector) service(sysstat) so that it saves the reports in log file “/var/log/sa/saDD” where DD represents Current day and already existing files will be archived.
$ systemctl start sysstat
$ systemctl enable sysstat
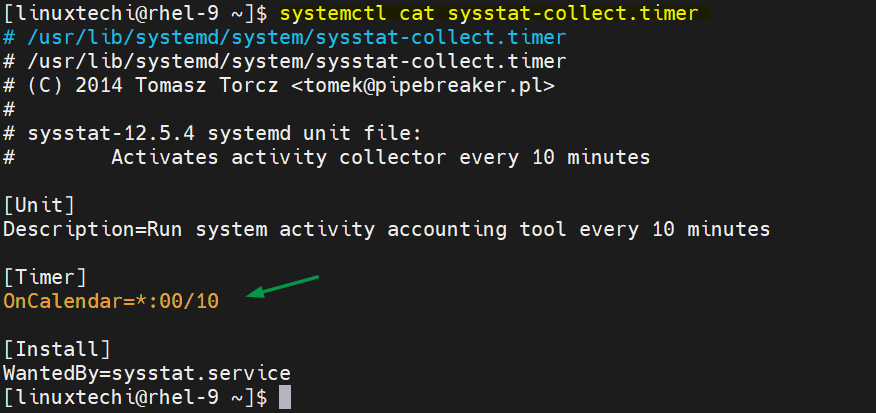
Once the sysstat service started then sar will start collecting the data every 10 minutes and generate its report daily. On RHEL like distributions, following systemd file is responsible for collecting and generating reports.
$ systemctl cat sysstat-collect.timer
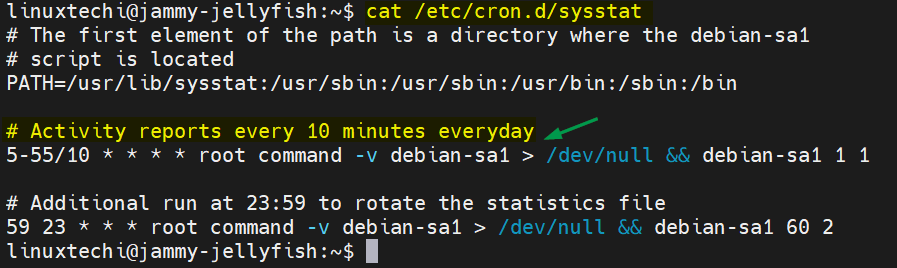
On Ubuntu 22.04/24.04, following cron tab is responsible for generating the report every 10 minutes.
$ cat /etc/cron.d/sysstat
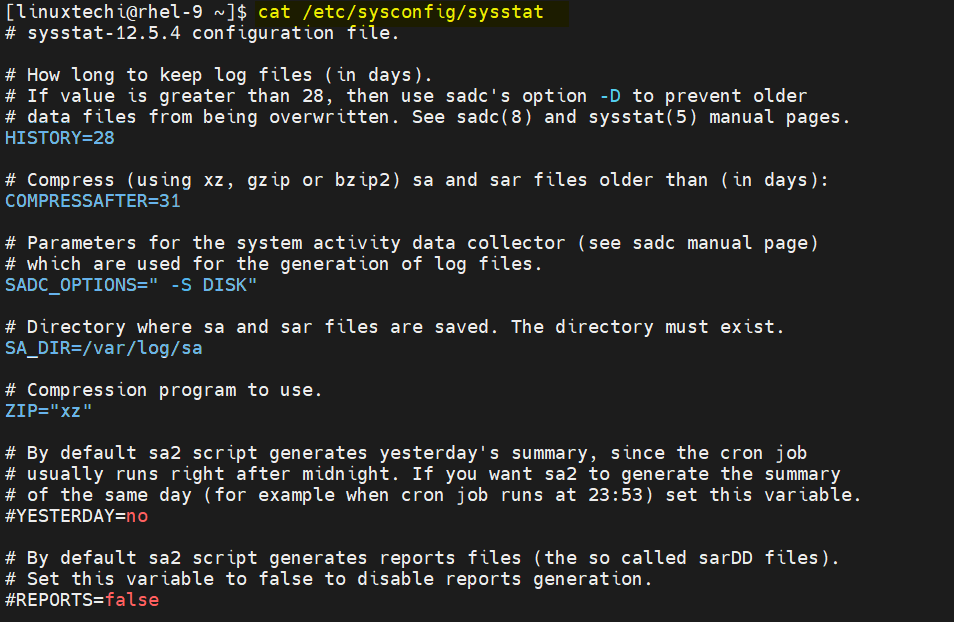
Below is the default config file of sysstat (sar command) on RHEL systems.
$ cat /etc/sysconfig/sysstat
Default Configuration of sysstat on Ubuntu 22.04/24.04
$ cat /etc/default/sysstat
Without any further delay, let’s deep dive into examples of sar command and see how the reports are generated.
1) Generate CPU Report on the Fly 5 times every 2 seconds
To generate the CPU report 5 times every 2 seconds, run
$ sar 2 5
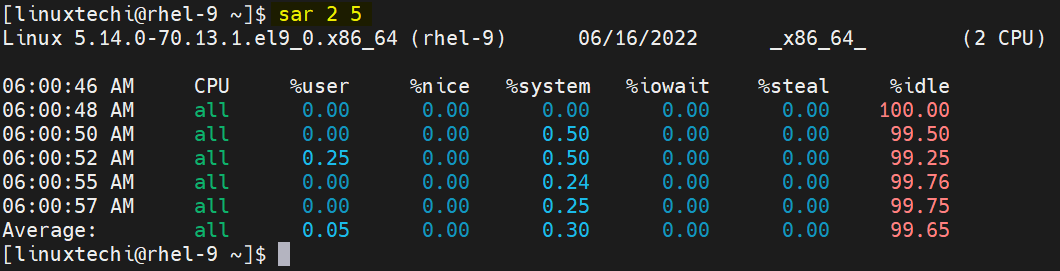
If the %I/O wait is more than zero for a longer period of time then we can consider there is some bottleneck in I/O system (Hard disk or Network )
2) Save sar command output to a file
To save the sar command output to a file, use -o option, example is shown below
$ sar 2 5 -o /tmp/data > /dev/null 2>&1
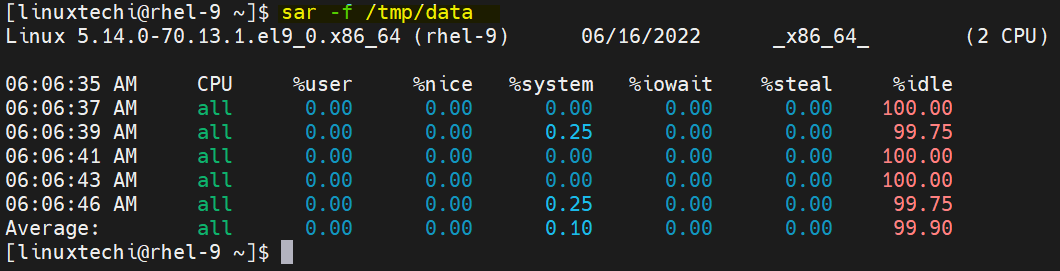
Now use “sar -f <file-name>” to display the reports.
$ sar -f /tmp/data
3) Generating Memory Usage Report
-r option in the sar command is used to generate memory usage report.
[root@localhost ~]# sar -r 2 5
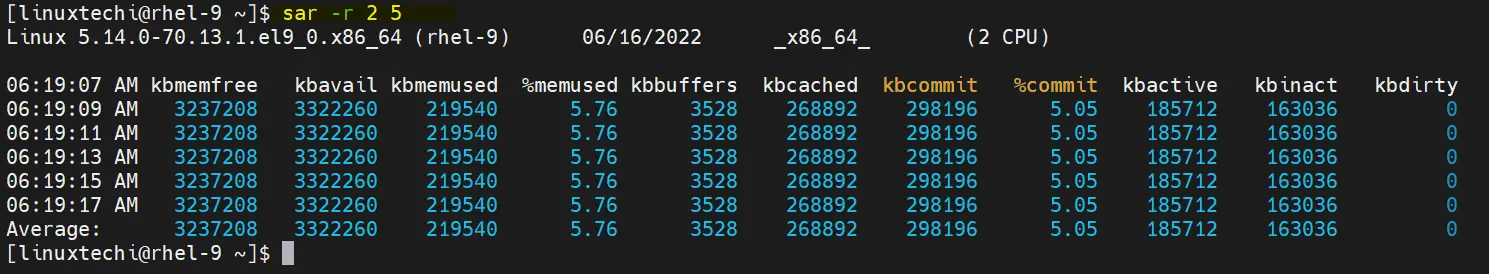
kbcommit & %commit is the overall memory used including RAM & Swap
4) Generating Paging Statistics Report
-B option in the sar command is used to display paging statistics. Example is shown below,
[root@localhost ~]# sar -B 2 5
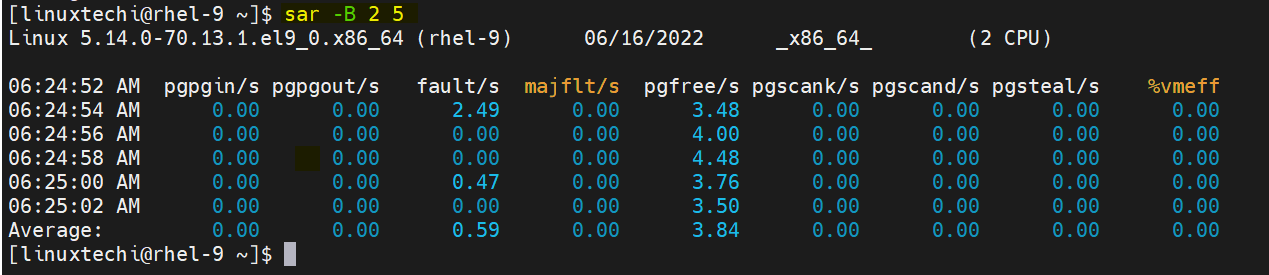
In the report majflts/s shows the major faults per second means number of pages loaded into the memory from disk (swap), if its value is higher then we can say that system is running out of RAM.
%vmeff indicates the number of pages scanned per second, if it’s vaule is 100 % its is consider OK and when it is below 30 % then there is some issue with virtual memory. Zero value indicates that there is no page scanned during that time.
5) Generating Block Device Statistics Report
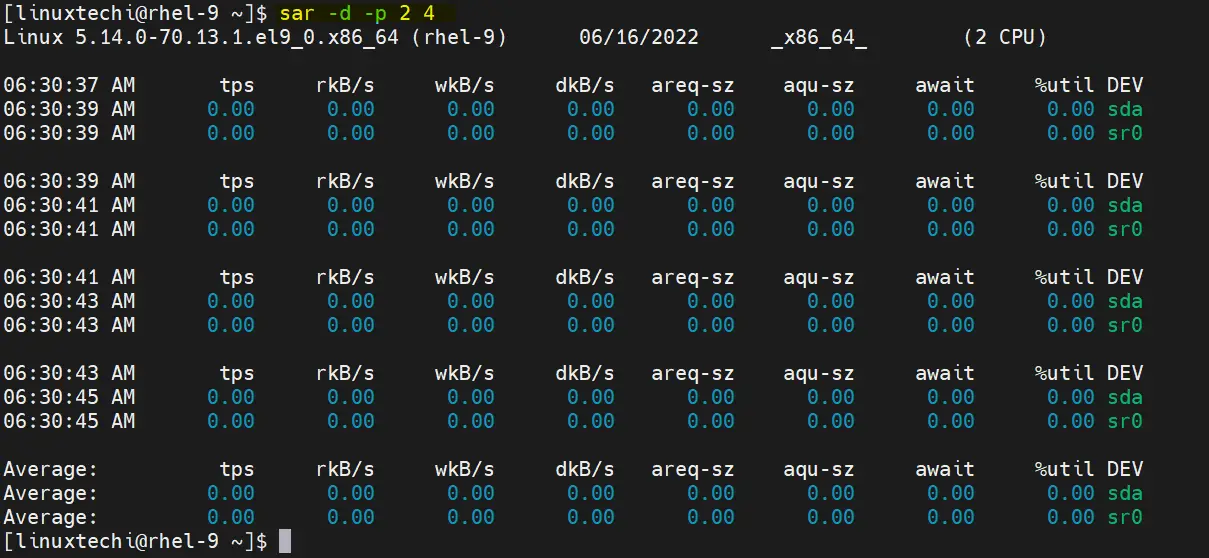
-d option in the sar command is used to display the block device statistics report. Using option -p (pretty-print) along with -d make the dev column more readable, example is shown below :
[root@localhost ~]# sar -d -p 2 4
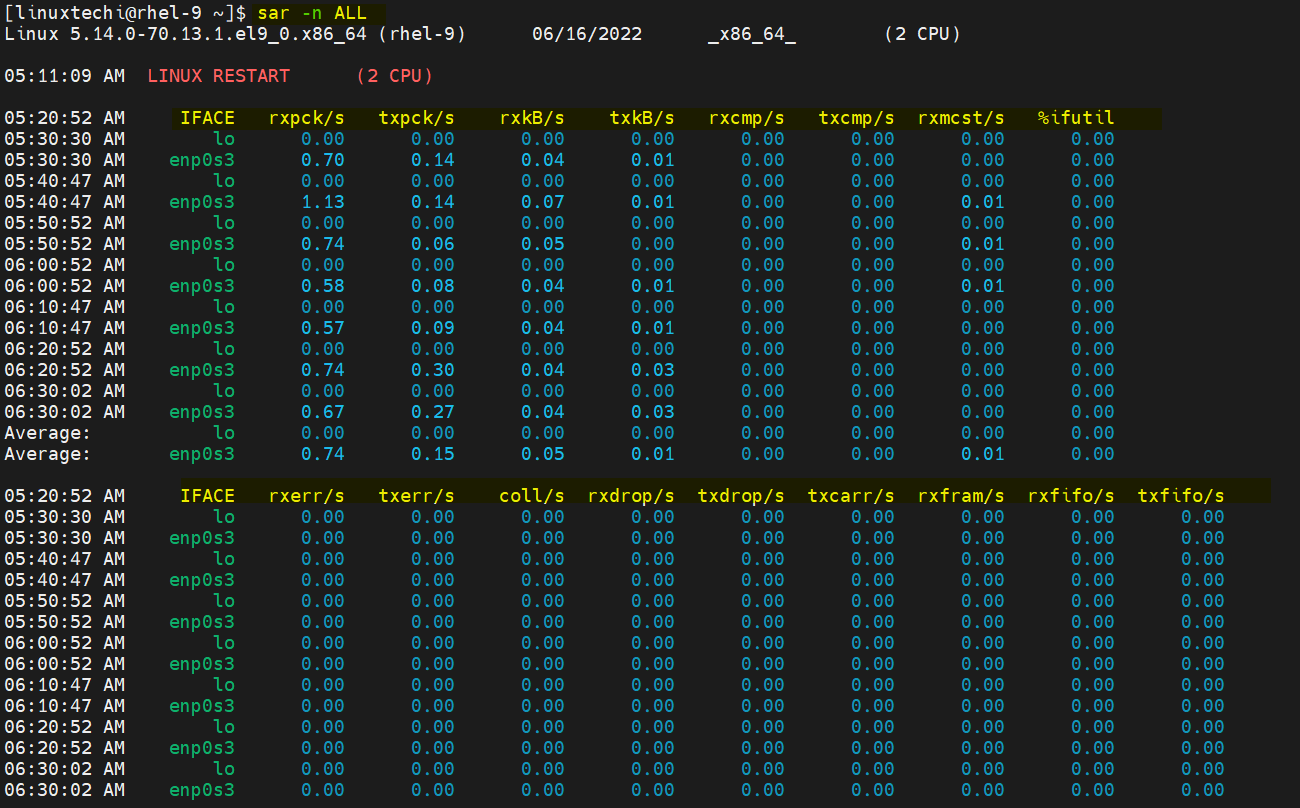
6) Generating Network Statistic Report
-n option in the sar command is used to generate network statistic report. Below is the synatx :
$ sar -n {keyword} or {ALL}
Following keywords can be used : DEV, EDEV, NFS, NFSD, SOCK, IP, EIP, ICMP, EICMP, TCP, ETCP, UDP, SOCK6, IP6, EIP6, ICMP6, EICMP6 & UDP6.
To generate all network statistic report run following command :
$ sar -n ALL
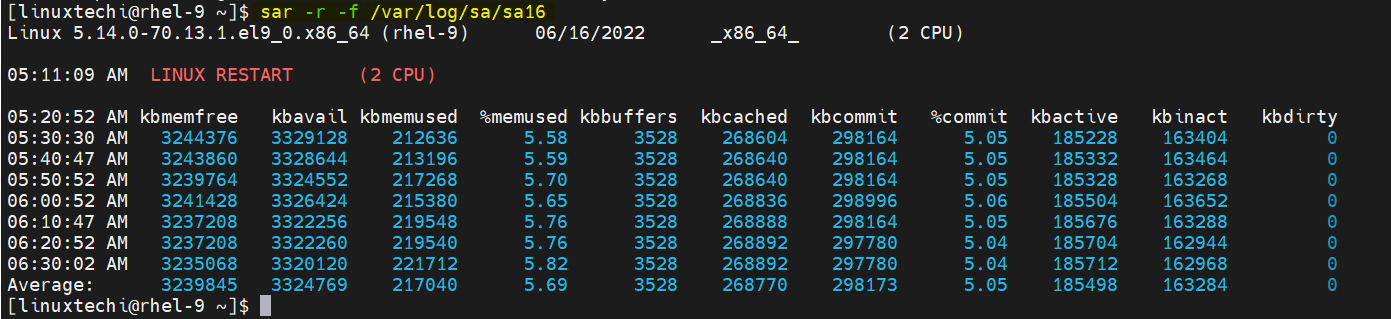
7) Reading SAR Log File using -f
As we have stated above that sar logs files are kept under /var/log/sa/saDD, using -f option in sar command we can read these log files. One example is shown below,
$ sar -r -f /var/log/sa/sa16
Read Also: How to Sync Time in Linux Server using Chrony
Read Also: 20 ps Command Examples to Monitor Linux Processes
Can some please explain what indicates 4 and 4 in this command sar -d -p 2 4
With which command can I see or generate a file (report) only the use of a full day of use, only the CPU, RAM and Internet Consumption?
It is to see the highest points of consumption.
Thank you
can we get whole month data in one file and upload in ksar ?
Great details ! Thank you !
Very good article! Thanks a lot for sharing your knowldge and keep workin on!
Best regards!
Hi,
Thanks for all the explanation and examples.
After playing around with it to generate reports over the previous day I came to the conclusion that when using the -f and -i option and -s 00:00:00 and -e 23:59:59 the last interval up to midnight is not reported on. In the example below the report goes up to 23:30:01. To me this means the period between 23:30 and 00:00(midnight) is not reported on.
I assume that the time displayed in the report is the end of the interval reports on.
Is there a way to show also the data for the last interval?
Thanks in advance for any help
[wlpfo@tqmode27x] as $ sar -i 1800 -f /var/log/sa/sa01 -s 00:00:00 -e 23:59:59 -u -t
Linux 3.10.0-1127.19.1.el7.x86_64 (server) 01/01/21 _x86_64_ (8 CPU)
00:00:01 CPU %user %nice %system %iowait %steal %idle
00:30:01 all 1.31 0.03 0.54 0.00 0.00 98.12
01:00:01 all 1.29 0.03 0.54 0.00 0.00 98.14
01:30:01 all 1.30 0.11 0.56 0.00 0.00 98.02
. . .
. . .
22:00:01 all 1.30 0.03 0.54 0.00 0.00 98.12
22:30:01 all 1.30 0.03 0.54 0.00 0.00 98.13
23:00:01 all 1.33 0.03 0.50 0.00 0.00 98.14
23:30:01 all 1.31 0.03 0.49 0.00 0.00 98.17
Average: all 1.31 0.03 0.53 0.00 0.00 98.13
Thanks for sharing this useful information.
Hello,
This is weird. When selecting SAR data per minute over a period of 24 hours the 59th minute of every hour is not displayed/calculated! Who has any idea about the cause and if it can be solved?!
00:57:01 all 1,77 4,30 0,66 0,00 0,00 93,26
00:58:01 all 2,04 4,63 0,70 0,00 0,00 92,63
01:00:01 all 1,82 4,45 0,68 0,00 0,00 93,06
01:01:01 all 3,25 8,72 1,10 0,01 0,00 86,92
01:57:01 all 2,16 5,34 0,79 0,00 0,00 91,70
01:58:01 all 2,24 5,07 0,77 0,00 0,00 91,92
02:00:01 all 2,19 5,35 0,80 0,00 0,00 91,66
02:01:01 all 2,54 6,31 0,91 0,00 0,00 90,23