Metricbeat is a lightweight shipper (or agent) which is used to collect system’s metrics and application metrics and send them to Elastic Stack Server (i.e Elasticsearch). Here system’s metrics refers to CPU, Memory, Disk and Network Stats (IOPS) and application metrics means monitoring and collecting metrics of applications like Apache, NGINX, Docker, Kubernetes and Redis etc. For metricbeat to work first we must make sure that we have a healthy elastic stack setup up and running. Please refer the below url to setup elastic stack:
How to Setup Multi Node Elastic Stack Cluster on RHEL 8 / CentOS 8
In this article we will demonstrate how install metricbeat on linux servers and then how metricbeat sends data to Elastic Stack Server (i.e Elasticsearch) and then we will verify from kiabana GUI whether metrics data is visible or not.
Install Metricbeat on CentOS / RHEL Servers
On CentOS / RHEL Servers, metricbeat is installed using the following rpm command,
[root@web-server ~]# rpm -ivh https://artifacts.elastic.co/downloads/beats/metricbeat/metricbeat-7.3.1-x86_64.rpm
For Debian based systems, use below command to install metricbeat.
~]# curl -L -O https://artifacts.elastic.co/downloads/beats/metricbeat/metricbeat-7.3.1-amd64.deb
~]# dpkg -i metricbeat-7.3.1-amd64.deb
Add the following lines in /etc/hosts file, as we will be using FQDN of Elasticsearch and Kibana in metricbeat config file and command,
Note: Change the IPs and Hostname as per your setup
192.168.56.40             elasticsearch1.linuxtechi.local
192.168.56.50             elasticsearch2.linuxtechi.local
192.168.56.60             elasticsearch3.linuxtechi.local
192.168.56.10             kibana.linuxtechi.local
Configure Metricbeat on Linux Server (CentOS / RHEL / Debian)
Whenever metricbeat rpm & deb package is installed then its configuration file (metricbeat.yml) is created under “/etc/metricbeat/“. Let’s edit this configuration file and inform system to send system and application metrics data to Elasticsearch servers.
[root@web-server ~]# vi /etc/metricbeat/metricbeat.yml

setup.kibana:
   host: "kibana.linuxtechi.local:5601"
output.elasticsearch:
    hosts: ["elasticsearch1.linuxtechi.local:9200","elasticsearch2.linuxtechi.local:9200","elasticsearch3.linuxtechi.local:9200"]
Save and exit the file
Note: Replace Elasticsearch and Kibana details that suits to your environment.
Run following metricbeat command so that metric dashboard become available in Kibana GUI.
[root@web-server ~]# metricbeat setup -e -E output.elasticsearch.hosts=['elasticsearch1.linuxtechi.local:9200','elasticsearch2.linuxtechi.local:9200','elasticsearch3.linuxtechi.local:9200'] -E setup.kibana.host=kibana.linuxtechi.local:5601
Output of above command would be something like below:
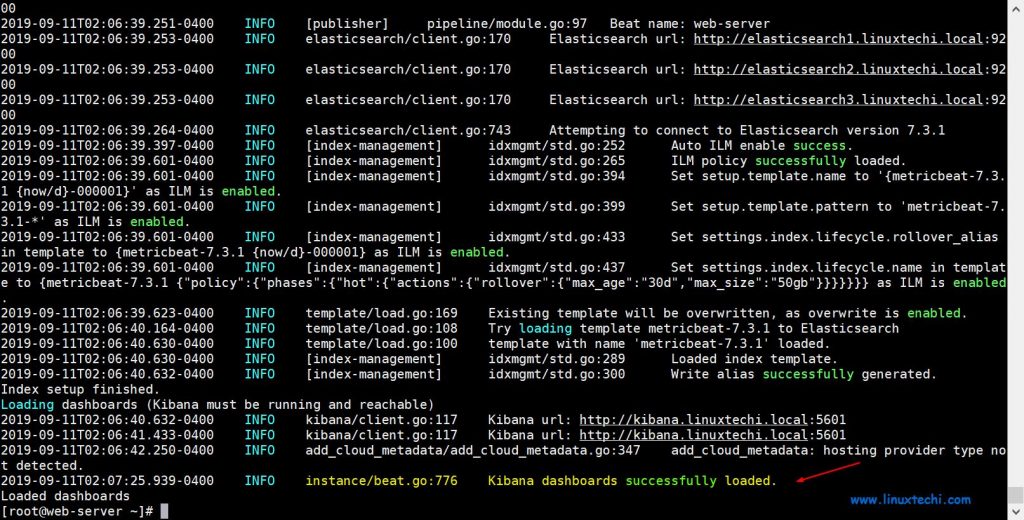
Above output confirms that metrics dashboard is loaded successfully in Kibana GUI. Now via metricbeat it will send the metrics data to Elastic Stack server every 10 seconds.
Let’s start and enable metricbeat service using following commands,
[root@web-server ~]# systemctl start metricbeat
[root@web-server ~]# systemctl enable metricbeat
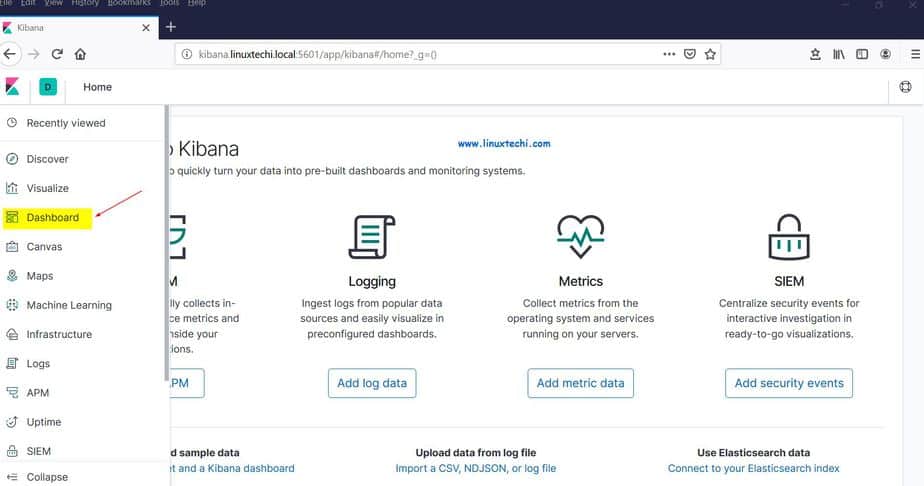
Now go to Kibana GUI and click on Dashboard from left side bar,
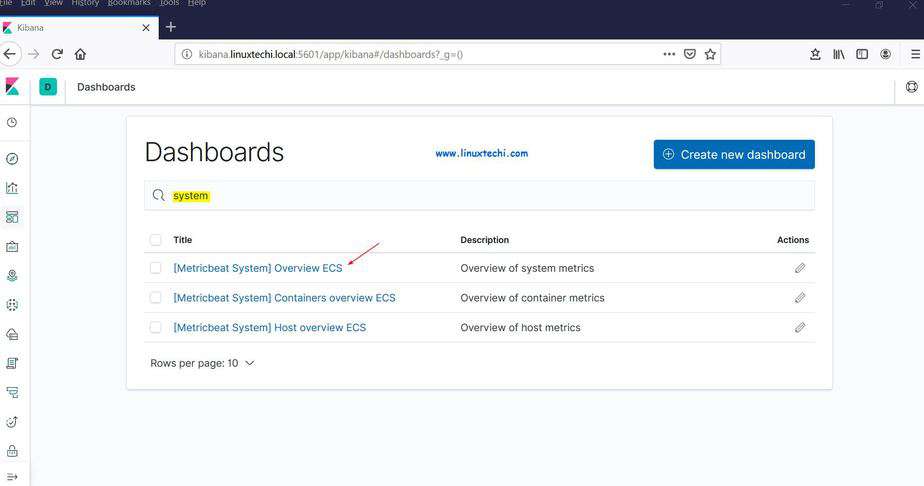
In the next window we will see available metrics dashboards, search ‘system’ and then choose System Metrics Dashboard,
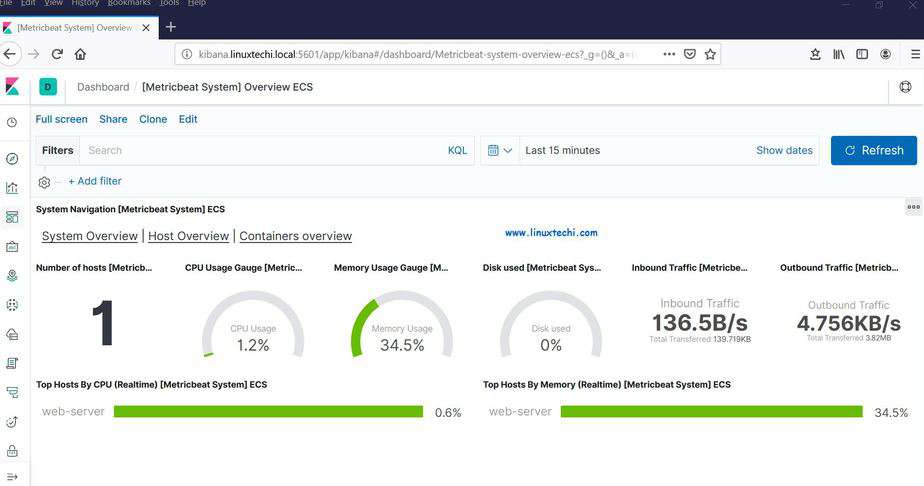
As we can see System’s metrics data is available on the dashboard, these metrics are collected based on entries mentioned in the file “/etc/metricbeat/modules.d/system.yml”
Let’s suppose we want to collect application’s metrics data as well then we have to first enable their respective modules, to enable Apache and MySQL metric module ,run the following command from client machine,
[root@web-server ~]# metricbeat modules enable apache mysql
Enabled apache
Enabled mysql
[root@web-server ~]#
Once we enable the modules, we can edit their yml file,
[root@web-server ~]# vi /etc/metricbeat/modules.d/apache.yml
…
- module: apache
  period: 10s
  hosts: ["http://192.168.56.70"]
…
Change IP in host parameter that suits to your environment.
Similarly edit mysql yml file, Change mysql root credentials that suits to your environment
[root@web-server ~]# vi /etc/metricbeat/modules.d/mysql.yml
………
- module: mysql
  metricsets:
    - status
    - galera_status
  period: 10s
hosts: ["root:a1b2c3d4f5@tcp(127.0.0.1:3306)/"]
………
After making the changes restart the metricbeat service,
[root@web-server ~]# systemctl restart metricbeat
Now Go to Kibana GUI and under Dashboard option, look for MySQL metrics,
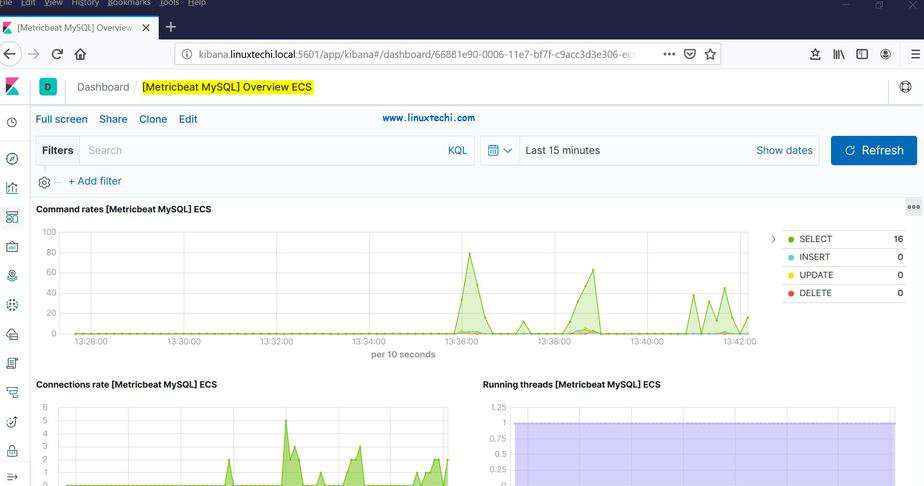
As we can see above, MySQL metrics data is visible, this confirms that we have successfully installed and configure metricbeat.
That’s all from tutorial, If these steps help you to setup metricbeat then please do share your feedback and comment.


Good article helped me in setting up metricbeat from scratch.
Does anyone knows how to monitor the services in linux server via metricbeat .
As far as I know, metricbeat can only be used to collect system/service metrics, however, you can use heartbeat if you have a service listening on a port. Heartbeat can monitor services listening on a TCP connection.