Monitoring Linux system is one of the most quintessential task that any Linux user or a systems administrator needs to carry out round the clock to ensure the system is running smoothly and avoid bottle-necks. Linux ships with a few built-in tools that can help you monitor your system. One of these is the ps (processes status) command that specifically monitors the running processes and among other metrics associated with the processes such as percentage CPU and memory utilization. The ps command reads the /proc filesystem which is RAM based or virtual file system.
In this guide, we dive deeper and let you on 20 of the most commonly used ps commands.
1) Listing Process in the Shell
The simplest form of the ps command in linux, lists the running processes in the current shell. This can be illustrated below.
[linuxtechi@webserver ~]$ ps
 PID TTY          TIME CMD
 1437 pts/0    00:00:00 bash
 1465 pts/0    00:00:00 ps
[linuxtechi@webserver ~]$
Let’s define a few terms:
- PID: This is the Process ID.
- TTY: This refers to the terminal that started and is controlling the process.
- TIME: This is the time / cumulative time that a process has run for.
- CMD: Name of the command that started the process.
2) Listing processes associated with a terminal
This is much like the listing the processes in the shell. To list the processes associated with the terminal you are currently running, execute the command:
[linuxtechi@webserver ~]$ ps -T
  PID  SPID TTY          TIME CMD
 1437  1437 pts/0    00:00:00 bash
13357 13357 pts/0    00:00:00 ps
[linuxtechi@webserver ~]$
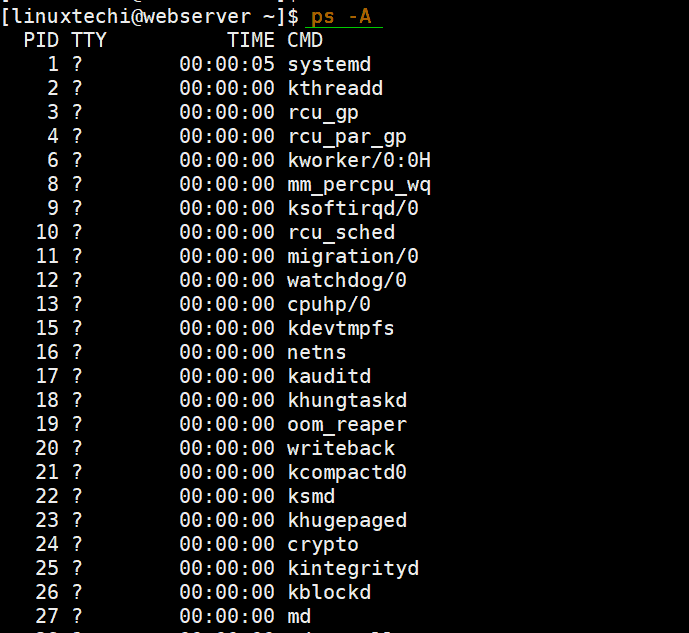
3) Displaying all the running processes on your system
To get an overview of all the running processes on your Linux system use the -A flag as shown:
[linuxtechi@webserver ~]$ ps -A
Alternatively, you can also use the –e flag as shown. You’ll still get similar results.
[linuxtechi@webserver ~]$ ps -e
4) Displaying output in BSD format
To list the processes in BSD format, run the command
$ ps -aux
Let’s break down the command:
The -a flag instructs ps to display all the processes from all the users. This, however, excludes the processes associated with a specific terminal.
The -u flag implies a user-oriented format. It provides more detailed information associated with the running processes.
The x flag lists processes that are usually started upon a system boot as well as background processes.
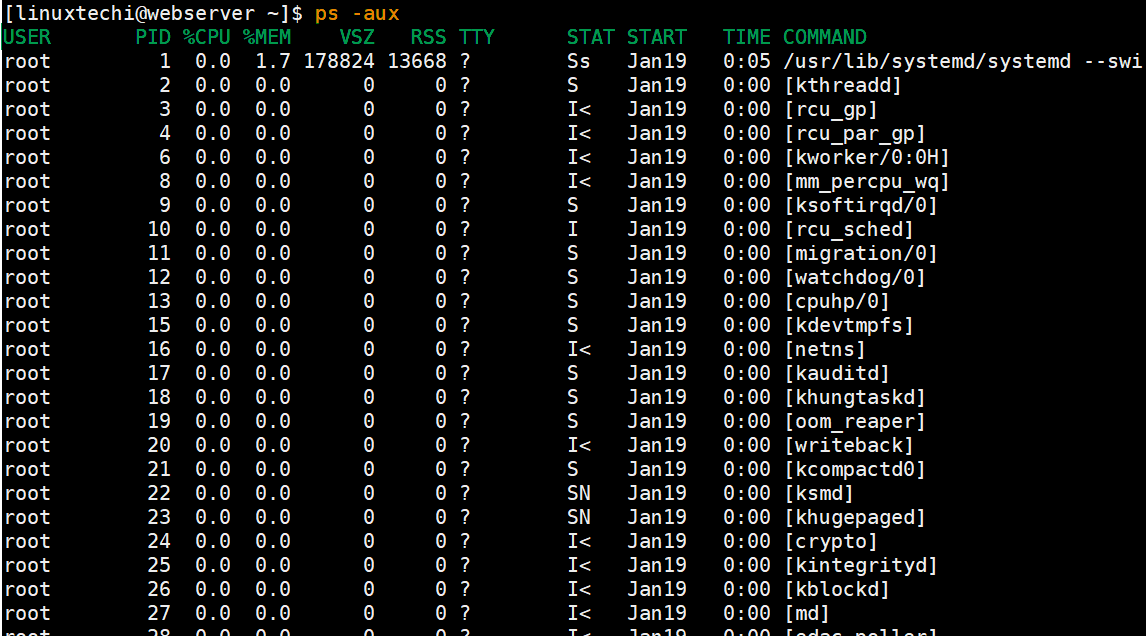
Where:
- USER – This specifies the user running the process
- PID – This is the Process ID of the process
- %CPU – This it the percentage CPU usage of each process
- %MEM – This is the % of the physical memory used up by the process
- VSZ – This is the size of virtual memory of each process in kilobytes
- RSS – This is the size/amount of physical memory being used by a process
- STAT – This points to the process state code e.g S (sleeping), Z (zombie) and R (Running)
- START – This is the time the process started running
5) Displaying output in UNIX format
If you wish to display the output in UNIX format , then execute the ps command with a combination of -ef flags
[linuxtechi@webserver ~]$ ps -ef
The -e flag tells the ps command to list all the processes
The -f flag (full format) instructs the ps command to list detailed information about the processes.
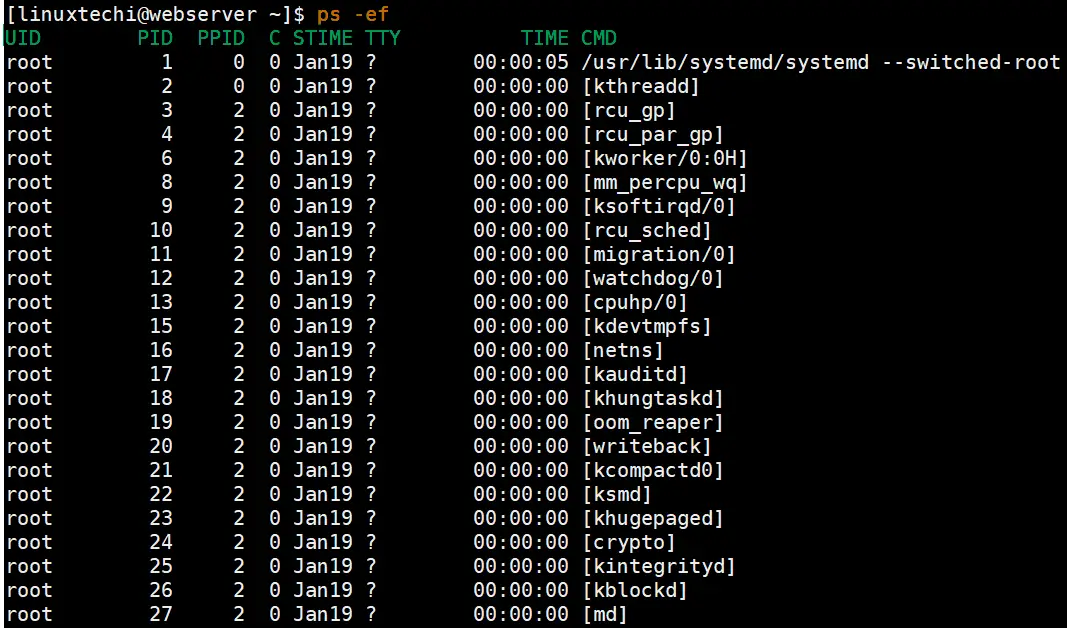
Let’s define a few new terms from the screenshot:
- PPID: This refers to the Parent Process ID
- C: This refers to the %CPU or percentage of the CPU utilization of a process.
- STIME: This points to the time the command was started. Same as START
6) Displaying output in a user-defined format
In a user-defined format output, you have the power to decide which columns to be displayed. The -o flag determines which columns will be displayed when running the ps command. In the example below, only the PID and START columns are displayed. Be sure to note the columns options are passed in lowercase in the ps command.
[linuxtechi@webserver ~]$ ps -efo pid,start
  PID  STARTED
 1437 21:55:28
13632 01:41:16
[linuxtechi@webserver ~]$
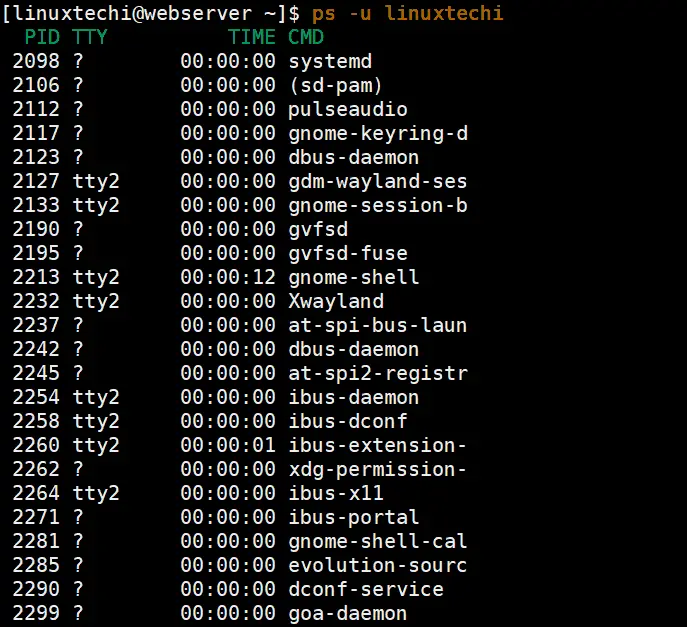
7) Show the current running processes of a user
Sometimes, you may want to find out processes that are associated with a certain user, so to achieve this, use the -u flag as shown”
$ ps -u user
OR
$ ps -u uid
For instance, to view processes associated with user ‘Linuxtechi’ run the command:
$ ps -u linuxtechi
Alternatively, you can use the user’s uid (User ID). You can get the user’s id by running the command:
$ id user
[linuxtechi@webserver ~]$ id linuxtechi
uid=1000(linuxtechi) gid=1000(linuxtechi) groups=1000(linuxtechi),10(wheel)
[linuxtechi@webserver ~]$
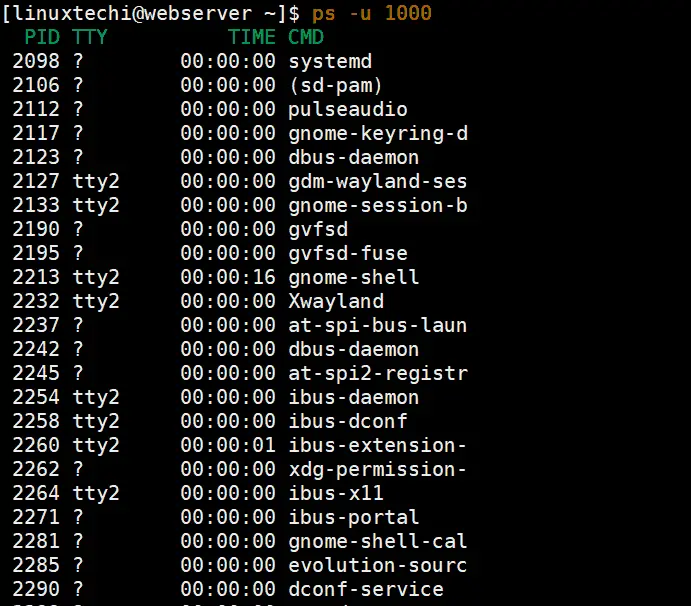
From the output above, we can clearly see that the uid for the user ‘linuxtechi’ is 1000. You can then use the ps command and the uid to find the processes associated with the user.
$ ps -u 1000
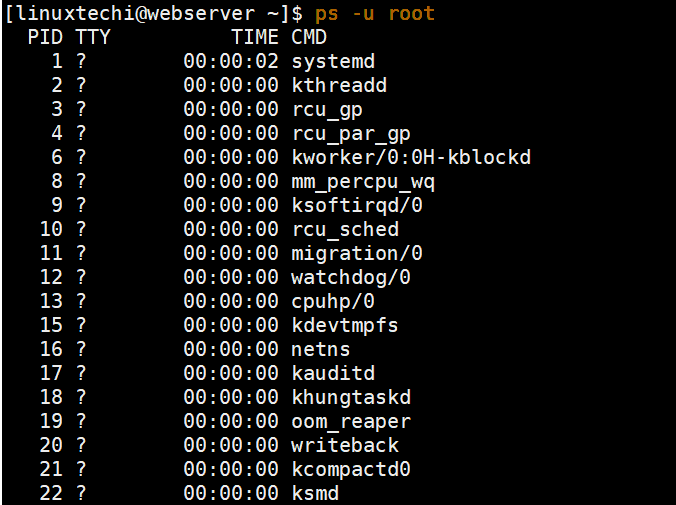
For the root user, run the command
$ ps -u root
Similarly, you can check using the uid of the root user whose value is 0
$ ps -u 0
8) Displaying group processes
Listing group processes is similar to listing user processes. You can list a group process using the ps command by passing the name of the group by specifying the group ID.
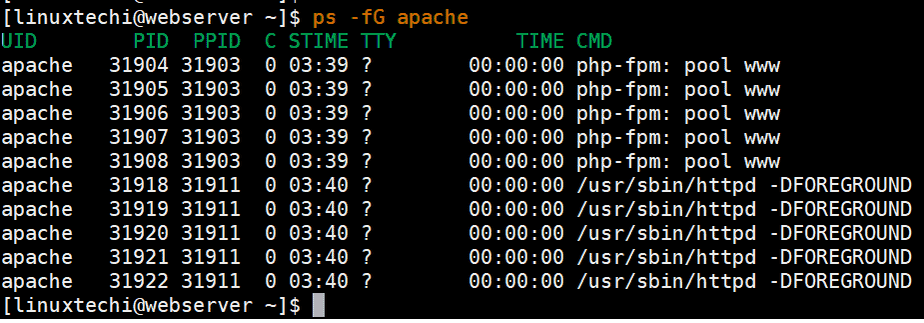
For example, to display the processes associated with the group ‘apache’ run the command:
$ ps -fG <group-name>
$ ps -fG apache
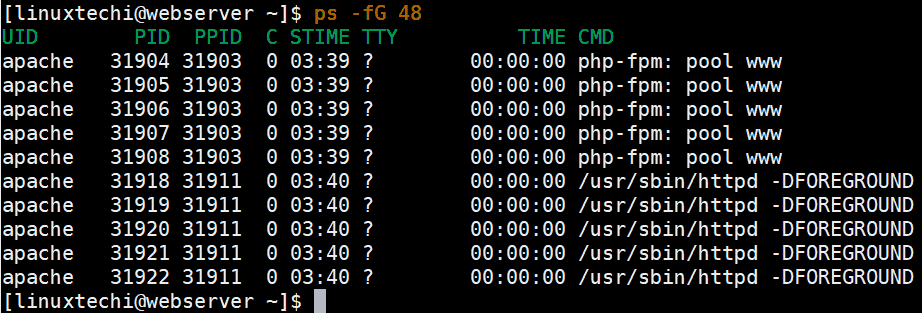
Alternatively, you can pass the group ID (gid) instead of the group name. you can obtain the GIDs from the /etc/group file.
For example, in this case, the group ID for Apache is 48. So, instead of specifying the group name ‘apache’ simply specify the GID no. 48.
$ ps -fG 48
9) Displaying processes using PID and PPID
Linux processes can also be displayed using the PID (Process ID) and the PPID (parent process ID). The PPID refers to the PID of the parent of a process.
To list processes by PID, run
$ ps -fp PID
For instance, to list the processes associated with PID 1286 run the command:
[linuxtechi@webserver ~]$ ps -fp 1286
UID        PID  PPID  C STIME TTY          TIME CMD
postfix   1286  1285  0 03:49 ?        00:00:00 pickup -l -t unix -u
[linuxtechi@webserver ~]$
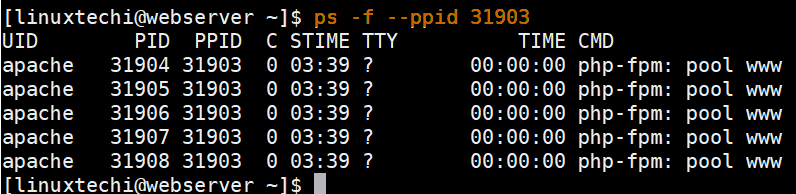
To list processes by PPID, run
$ ps -f –ppid <ppid-number>
For example, to list processes owned by PPID 31903 run
$ ps -f --ppid 31903
10) Searching for a PID using process name
For the most of the time we usually do not know the PID of the process name. To do so, use the -C flag as shown
$ ps -C <process-name>
[linuxtechi@webserver ~]$ ps -C firefox
  PID TTY          TIME CMD
 1446 tty2     00:00:04 firefox
[linuxtechi@webserver ~]$
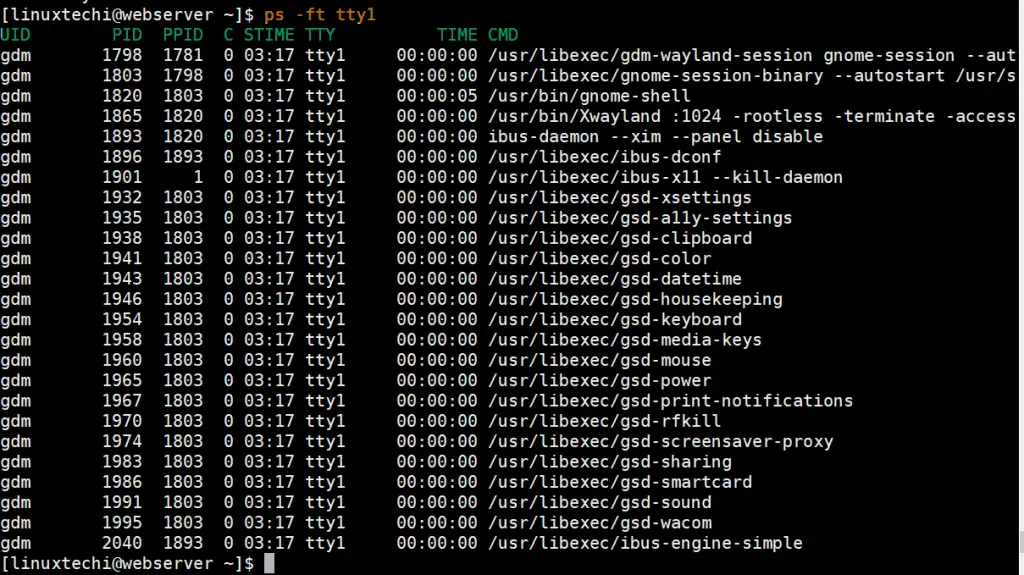
11) Displaying process using TTY
If you wish to filter processes by the tty value use the -t flag. For example to display the processes attached to tty1, run the ps command as shown:
$ ps -ft tty1
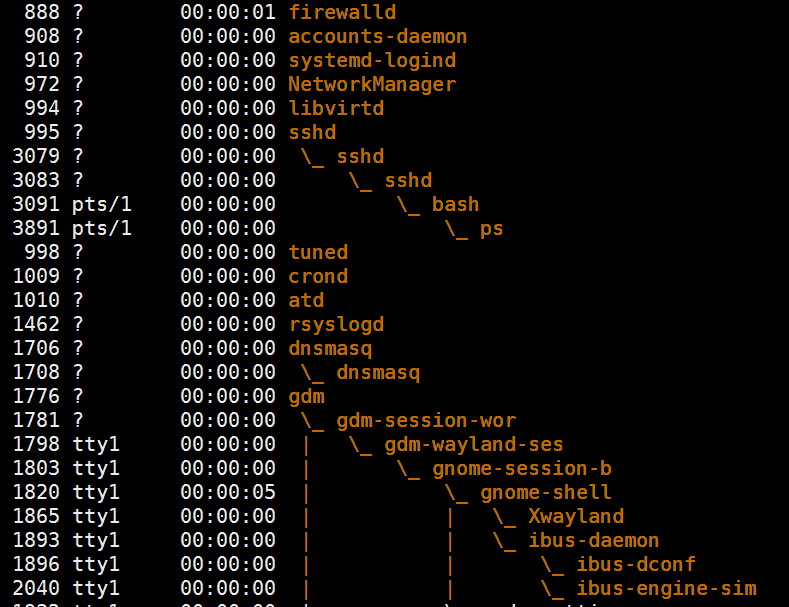
12) Printing the Process Tree
A process tree shows how processes are linked in a Linux system. Processes with no parents link to the system through init or systemd. Printing requires that you use the following format:
$ ps -e --forest
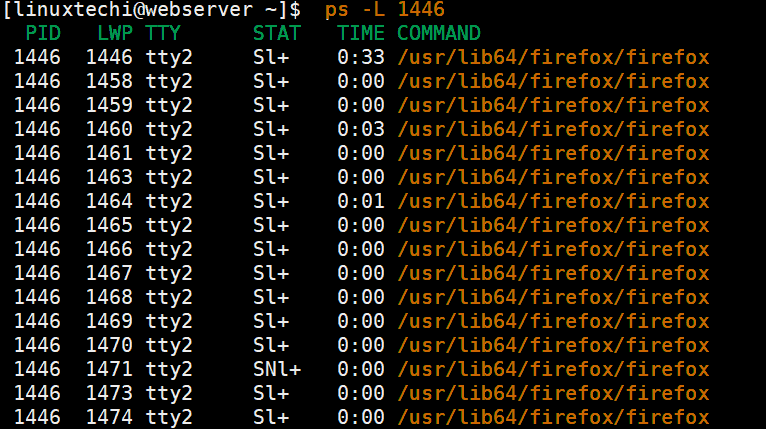
13) Filter a process according to the thread process
To filter a process using the process thread, use the -L flag as shown,
$ ps -L 1446
14) Real-time Process Monitoring
You can use the watch utility to monitor static information about a process. The output plays every second as shown below
$ watch -n 1 'ps -eo pid,ppid,cmd,%mem,%cpu --sort=-%cpu | head'
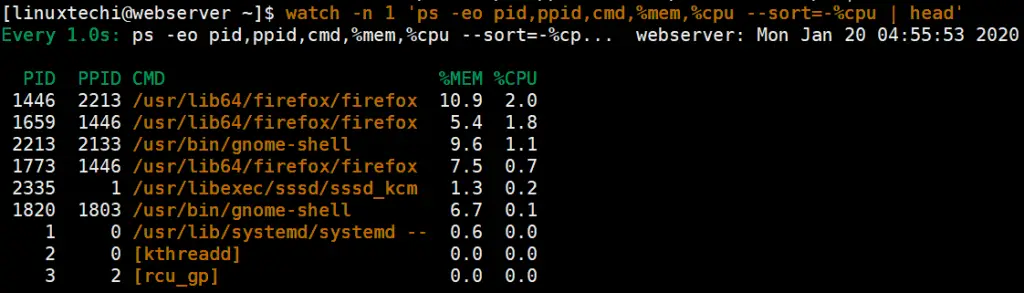
The command prints the pid,ppid,cmd,%mem and %cpu columns and monitors the statistics every single second while sorting the %CPU utilization in descending order.
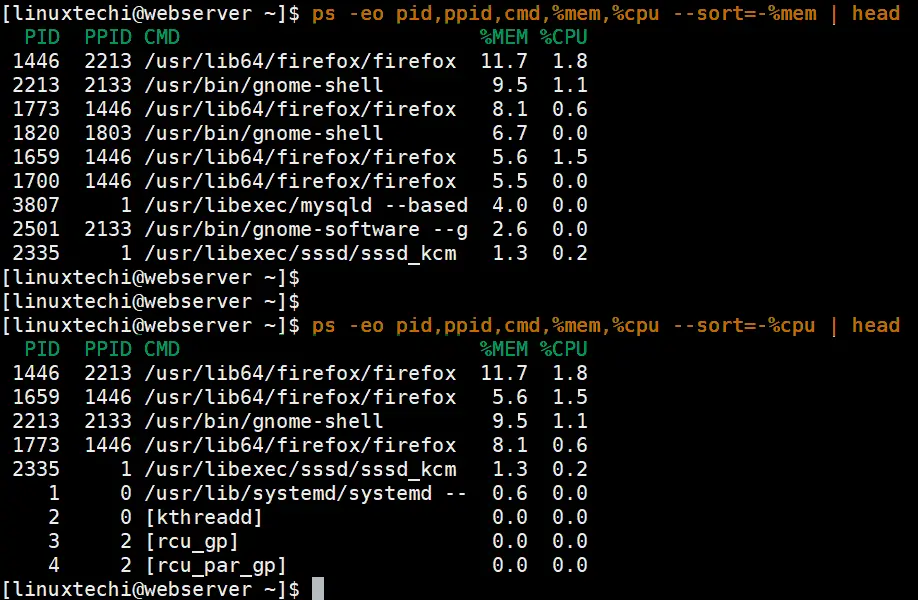
15) Troubleshoot Performance Issues of Linux Machine
When your system is slow or overloaded, you can Identify the top running process by highest CPU and memory usage
Execute following ps command to list top process which are consuming high memory,
$ ps -eo pid,ppid,cmd,%mem,%cpu --sort=-%mem | head
Execute following ps command to list top process which are consuming high cpu,
$ ps -eo pid,ppid,cmd,%mem,%cpu --sort=-%cpu | head
Sample output of above ps command on my system is below,
16) Killing unresponsive processes
The ps command can allow you to kill unresponsive applications or any processes that are hogging CPU and RAM. To do this, you need to find the PID of that particular application using the command:
$ ps -A | grep -i stress
Once you’ve found the PID of the process, you can terminate it using the kill command, example is shown below,
$ kill -9 2583 2584
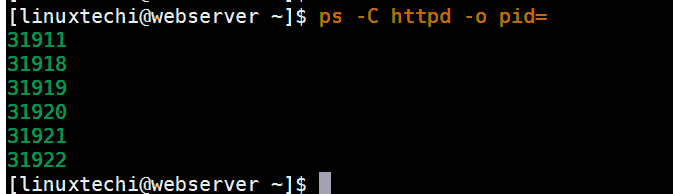
17) List all PID’s of all process instances
You can list all the PIDs associated with a process by using the syntax:
$ ps -C <process-name> -o pid=
For example to find out the PIDs associated with httpd web server run:
$ ps -C httpd -o pid=
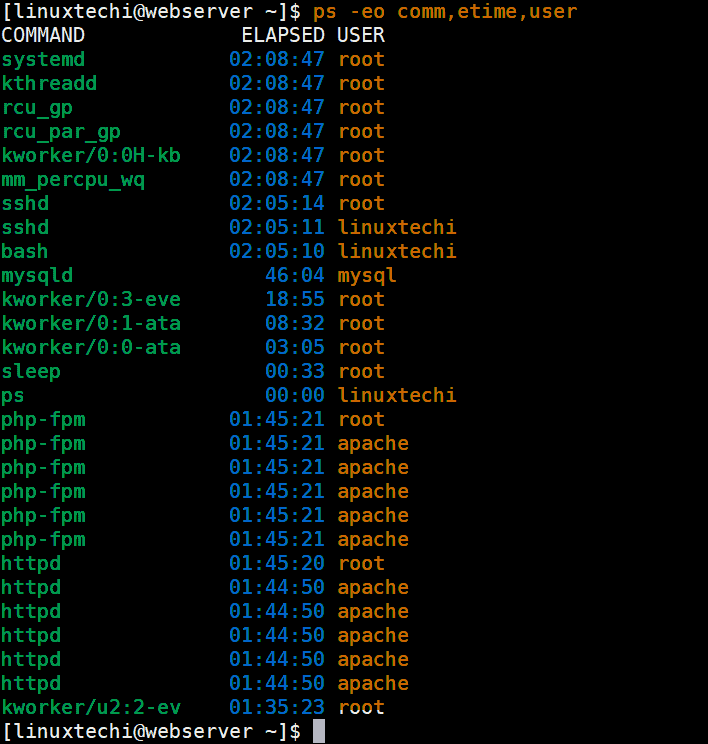
18) Display the duration that processes have been running
To show for how long processes have been running, run the command:
$ ps -eo comm,etime,user
Use below ps command to know how long a particular process has been running,
$ ps -o etime -p <pid>
Let’s suppose we want to know about mysql process
[linuxtechi@webserver ~]$  ps -C mysqld -o pid=
 3807
[linuxtechi@webserver ~]$
[linuxtechi@webserver ~]$ ps -o etime -p 3807
    ELAPSED
   01:13:56
[linuxtechi@webserver ~]$
19) List child processes of a process
To print or list the child processes of a process, use -C flag in the syntax below:
$ ps -C <process-name>
For example, to list child processes associated with httpd process, run
[linuxtechi@webserver ~]$ ps -C httpd
  PID TTY          TIME CMD
31911 ?        00:00:00 httpd
31918 ?        00:00:00 httpd
31919 ?        00:00:00 httpd
31920 ?        00:00:01 httpd
31921 ?        00:00:01 httpd
31922 ?        00:00:01 httpd
[linuxtechi@webserver ~]$
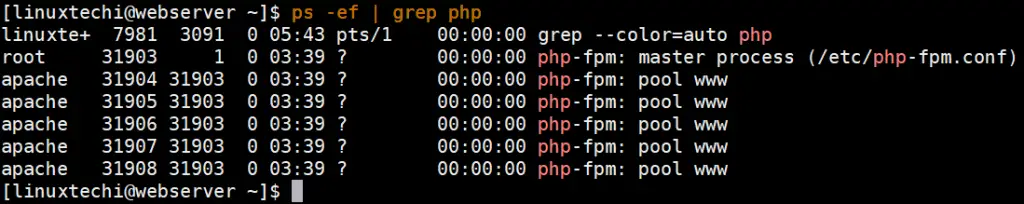
20) Filtering output of ps command using grep
To get specific results in ps command , you can pipe the output to grep utility tool and provide the search criteria.
For example , to search or narrow down to php process, run the command:
$ ps -ef | grep php
We have listed the top 20 ps commands that are commonly used for listing and monitoring the processes running on your Linux system . These commands will work across all Linux distributions and will certainly give you an overview of the processes running on your system and help you determine which are overworking your CPU and RAM resources. Did you find this guide insightful ? Feel free to like and share it across your social media platforms. Your feedback is most welcome.
Read Also : 25 Top Command Examples to Monitor Linux Server Performance

Hi,
Like the way you’ve presented the article. Liked every example used for monitoring linux processes. Pls. continue your good work for the linux community…
Thank you Pradeep Kumar,
Your explanations are clear, concise and presented in a way that I (Debian novice) could readily understand.
Marj