In this tutorial, we will learn how to monitor Kubernetes using Prometheus and Grafana
Kubernetes is a powerful system that helps teams run and manage containerized applications at scale. But with that power comes complexity. A lot of things happen in the shadows-applications run in containers, on pods, on many machines. In order for things to run smoothly, we need to know exactly what’s going on.
That’s where monitoring comes in. Monitoring a Kubernetes cluster means monitoring all of its parts, checking that everything is healthy, fast, secure, and doing what it’s supposed to do.
Why Monitoring Kubernetes Matters
Think of Kubernetes as an intelligent traffic controller for your application. It moves things around automatically and scales up and down as needed. But what if something goes wrong?
- Pods can crash.
- A node might run out of memory.
- The service may stop responding.
Without monitoring, you might not notice these problems until users complain.
With monitoring, you can:
- Identify problems early and fix them as soon as possible.
- Understand what’s using too many resources.
- Understand how your application is performing over time.
What to Monitor in a Kubernetes Cluster
Kubernetes has many layers. Here are some things to keep in mind:
1. Nodes (machines)
These are the servers that run your containers.
Monitor:
- CPU and memory usage
- Disk space
- Network traffic
- Whether nodes are online
2. Pods and Containers (where your applications reside)
These are the units that run the actual application code.
Monitor:
- Whether pods are running, restarting, or crashing
- How much CPU and memory they are using
- How many replicas are running vs. what is expected
3. Kubernetes components
These are the services that make Kubernetes work.
Monitor:
- API servers (are they slowing down or failing?)
- etcd (Kubernetes’ database)
- Scheduler and controller administrators
4. Networks and Services
Kubernetes applications talk to each other over the network.
Monitor:
- Service Availability
- DNS issues
- Slow or dropped network requests
Tools to Monitor Kubernetes
Here are popular tools to help you monitor your cluster:
Prometheus + Grafana
Prometheus is an open source metrics collection and alerting system. It collects time-series data (e.g., CPU usage, pod restarts) over HTTP endpoints. It supports Prometheus Query Language (PromQL) to extract meaningful insights from your raw metrics. Prometheus integrates seamlessly with OpenTelemetry and Jaeger to provide a comprehensive observable solution.
Grafana is a visualization and dashboard tool. It connects to Prometheus (and other data sources) to display data. Grafana supports alerts, annotations, and user access control.
Combining Prometheus and Grafana gives you an end-to-end view of your Kubernetes cluster. Together, they help you collect, store, visualize, and analyze metrics from control planes, nodes, pods, containers, and applications.
Kubernetes Dashboard
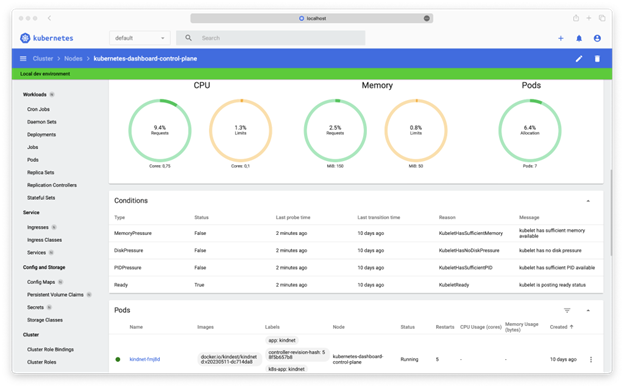
The Kubernetes Dashboard is a built-in web-based user interface (UI) for Kubernetes. It provides a convenient way to view and manage cluster resources. While it’s helpful for basic cluster visibility and management, it has limited monitoring capabilities compared to full observability tools like Prometheus, Grafana, or Loki.
Loki
Loki logging (non-metric) tool from Grafana Labs. Helps you search the logs when there is a problem. It integrates with Grafana allowing you to visualize logs and Prometheus metrics for unified troubleshooting.
Elastic Stacking (ELK)
The ELK stack is a popular open source logging and analytics platform consisting of three core components, Elasticsearch(search engine), Logstash(log collection and parsing), and Kibana(dashboard UI).
In Kubernetes, ELK is primarily used for log aggregation, search, and analysis. It collects logs from pods, nodes, and applications running in the cluster.
Rich dashboards and search capabilities are available in Kibana to troubleshoot and monitor cluster health.
Cloud Monitoring Tools
If you use cloud providers like AWS, Azure, or Google Cloud, they offer built-in monitoring tools like:
- AWS CloudWatch for EKS
- Azure Monitor for AKS
- Google Cloud Operations Suite for GKE
How to Monitor Kubernetes using Prometheus and Grafana
We’ll be deploying the full kube-prometheus-stack. The stack will provide a suite of tools that gives you a comprehensive view of your Kubernetes cluster.
Prerequisites:
This section assumes you have already setup a working Kubernetes cluster. If not, you can use k3s to spin up a local Kubernetes cluster. Refer to the k3s installation docs here.
Step 0: Setup k3s for helm usage
Helm utilizes kubeconfig file to talk to the Kubernetes cluster and install applications.
# Copy kube config from non-standard location
sudo cp /etc/rancher/k3s/k3s.yaml ~/.kube/config
# Grant permission to the current user and group
sudo chown $(id -u):$(id -g) ~/.kube/config
Step 1: Install some applications (Optional)
Before we dive into monitoring, it’s really helpful to have something to monitor! Let’s install WordPress and Redis with helm.
helm repo add bitnami https://charts.bitnami.com/bitnami
helm repo update
Install applications:
helm install my-redis bitnami/redis \
  --set architecture=standalone
helm install my-wordpress bitnami/wordpress
Tip: To access WordPress site locally, you can do:
kubectl port-forward svc/wordpress 8000:80
Then, you can access the WordPress site from http://localhost:8000.
If you receive errors like HostPath mounts failing with “Path is not a shared or slave mount”, run this command to recursively changes the mount propagation of your root file system.
sudo mount --make-rshared /
Step 2: Install Prometheus stack
Add the Prometheus Community’s Helm repository and install.
helm repo add prometheus-community https://prometheus-community.github.io/helm-charts
helm repo update
helm install prometheus-stack prometheus-community/kube-prometheus-stack
Step 3: Verify the installation
You can check status of kube-prometheus-stack by running:
kubectl --namespace default get pods -l "release=monitoring"
Step 4: Access Grafana UI
export POD_NAME=$(kubectl --namespace default get pod -l "app.kubernetes.io/name=grafana,app.kubernetes.io/instance=monitoring" -oname)
kubectl --namespace default port-forward $POD_NAME 3000
Now, you can access the UI on http://localhost:3000.
The default credential for Grafana installation in a Kubernetes environment is admin/prom-operator.
Step 5: Explore default dashboards
The stack you deployed has already configured Prometheus and AlertManager as data source for Grafana.
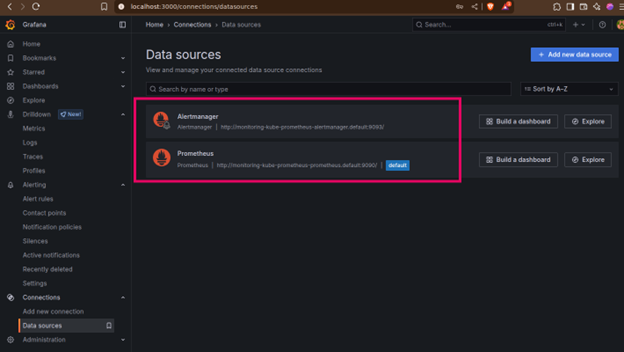
It’s time to explore some dashboards.
To get an overview of our Kubernetes cluster, you can utilize the dashboard- Kubernetes / Compute Resources / Cluster.

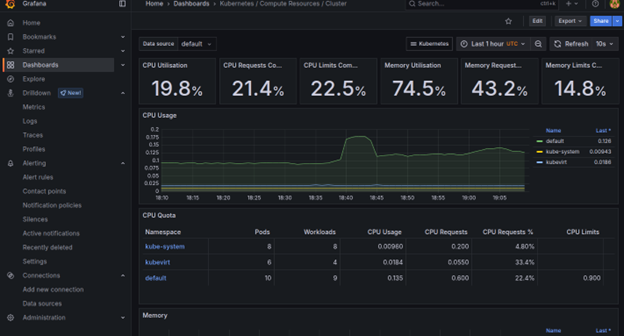
Similarly, the dashboard Kubernetes / Compute Resources / Nodes will break down resource usage per individual node.
Here are the additional dashboards you might want to explore:
- Kubernetes / Compute Resources / Pods: Provides a detailed view of resource consumption for individual pods.
- Kubernetes / Compute Resources / Namespace (Workloads): Aggregates metrics by namespace or by specific workload types (Deployments, StatefulSets, DaemonSets).
- Node Exporter / Nodes: This dashboard is derived from the node-exporter component and provides very fine-grained details about the underlying host operating system (Kubernetes nodes).
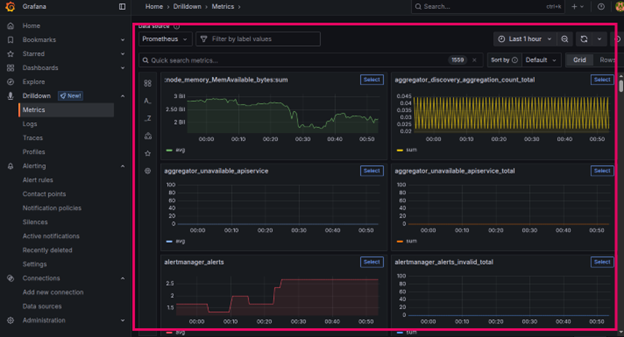
Step 6: Explore Prometheus Metrics
Under Drilldown -> Metrics, you can view all captured Prometheus metrics.
Conclusion
We have just scratched the surface of Kubernetes monitoring with Prometheus + Grafana stack. This powerful duo forms the backbone of a sophisticated monitoring system that lets you not only know if a service is “up and running,” but also really understand its performance, predict problems, and gain insight into your entire cloud-native environment.
You can expose customized metrics such as API request rates, transaction duration, number of unique users, or business-specific KPIs. And when Prometheus scrapes these customized metrics through ServiceMonitor or PodMonitor resources, you can build Grafana dashboards that give you a direct view of the health and performance of your applications from a business perspective, not just an infrastructure perspective.