In this blog post, we will cover top 10 dmesg command examples in Linux.Dmesg command is used to analyse and troubleshoot kernel messages in Linux.
In the realm of Linux troubleshooting and system monitoring, the “dmesg” command holds a key to uncovering valuable insights about the kernel and its interaction with hardware and software components. Short for “display message,” dmesg provides a wealth of information from the system’s kernel ring buffer.
While doing troubleshooting on Linux systems, dmesg command becomes very handy, it can help us to identify hardware related errors and warnings, apart from this it can print daemon related messages on your screen.
Syntax
# dmesg {options}
Options:
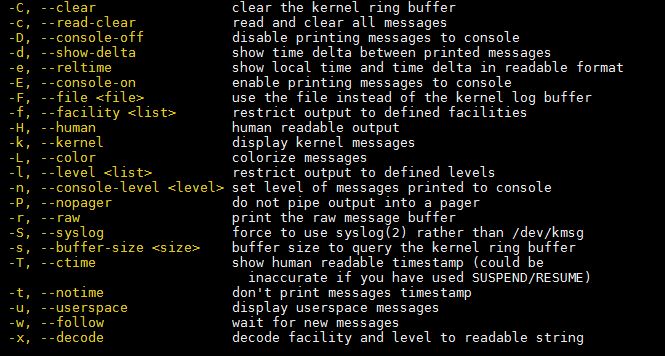
Without any further delay, let’s deep dive into examples of dmesg command.
1. Viewing the Kernel Ring Buffer
At its core, the dmesg command provides access to the kernel’s ring buffer, which stores important messages related to system events and hardware initialization. Simply executing the command “dmesg” without any options will display the most recent messages from the kernel.
~]# dmesg
dmesg command will print all messages but you will only see the latest message that fits on screen, if you want to do the analysis all the logs and display them as page wise then use less or more command,
~]# dmesg | less
Output of dmesg command would be something like below,
2. Investigating CPU, Memory, Hard disk, USB drives and Serial ports Issues
When dealing with CPU or memory-related problems, dmesg can provide useful information. Look for messages indicating CPU throttling, memory allocation failures, or unusual behavior that might be affecting system performance.
In dmesg command output we can search the messages related to RAM, Hard disk , usb drive and Serial ports.
~]# dmesg | grep -i memory
~]# dmesg | grep -i dma
~]# dmesg | grep -i usb
~]# dmesg | grep -i tty
These above commands can be merged into a single command using multiple grep option (-E), example is shown below,
~]# dmesg | grep -E "memory|dma|usb|tty"
Output would be something like below:
[    4.100608] usb 4-1: SerialNumber: serial
[    4.102288] [TTM] Zone  kernel: Available graphics memory: 49438090 kiB
[    4.102294] [TTM] Zone   dma32: Available graphics memory: 2097152 kiB
[    4.102891] input: Logitech USB Keyboard as \
/devices/pci0000:00/0000:00:1d.2/usb8/8-1/8-1:1.0/input/input2
[    4.109905] input: American Megatrends Inc. \
Virtual Keyboard and Mouse as \
/devices/pci0000:00/0000:00:1a.1/usb4/4-1/4-1:1.0/input/input3
[    4.153575] hid-generic 0003:046D:C31C.0001: \
input,hidraw0: USB HID v1.10 Keyboard [Logitech USB Keyboard] \
 on usb-0000:00:1d.2-1/input0
[    4.199642] input: Logitech USB Keyboard as \
/devices/pci0000:00/0000:00:1d.2/usb8/8-1/8-1:1.1/input/input4
[    4.204832] hid-generic 0003:046B:FF10.0002: \
input,hidraw1: USB HID v1.10 Keyboard [American Megatrends Inc. \
Virtual Keyboard and Mouse] on usb-0000:00:1a.1-1/input0
[    4.211855] input: American Megatrends Inc. Virtual Keyboard and \
 Mouse as /devices/pci0000:00/0000:00:1a.1/usb4/4-1/4-1:1.1/input/input5
[    4.239313] ata1: SATA max UDMA/133 cmd 0x8138 ctl 0x814c bmdma 0x8110 irq 19
[    4.239317] ata2: SATA max UDMA/133 cmd 0x8130 ctl 0x8148 bmdma 0x8118 irq 19
[    4.255839] hid-generic 0003:046D:C31C.0003: input,hidraw2: \
 USB HID v1.10 Device [Logitech USB Keyboard] on usb-0000:00:1d.2-1/input1
[    4.256191] hid-generic 0003:046B:FF10.0004: input,hidraw3:\
 USB HID v1.10 Mouse [American Megatrends Inc. Virtual Keyboard and \
Mouse] on usb-0000:00:1a.1-1/input1
[    4.392050] ata3: SATA max UDMA/133 cmd 0x8128 ctl 0x8144 bmdma 0x80f0 irq 21
[    4.392051] ata4: SATA max UDMA/133 cmd 0x8120 ctl 0x8140 bmdma 0x80f8 irq 21
[   19.125903] ioatdma: Intel(R) QuickData Technology Driver 4.00
[   19.126493] ioatdma 0000:00:16.0: irq 140 for MSI/MSI-X
[   19.128248] ioatdma 0000:00:16.1: irq 142 for MSI/MSI-X
[   19.129953] ioatdma 0000:00:16.2: irq 144 for MSI/MSI-X
[   19.131926] ioatdma 0000:00:16.3: irq 146 for MSI/MSI-X
[   19.134235] ioatdma 0000:00:16.4: irq 147 for MSI/MSI-X
[   19.135688] ioatdma 0000:00:16.5: irq 148 for MSI/MSI-X
[   19.137522] ioatdma 0000:00:16.6: irq 149 for MSI/MSI-X
[   19.140174] ioatdma 0000:00:16.7: irq 150 for MSI/MSI-X
[   19.141931] ioatdma 0000:80:16.0: irq 152 for MSI/MSI-X
[   19.161974] ioatdma 0000:80:16.1: irq 154 for MSI/MSI-X
[   19.167511] ioatdma 0000:80:16.2: irq 156 for MSI/MSI-X
[   19.169293] ioatdma 0000:80:16.3: irq 158 for MSI/MSI-X
[   19.170821] ioatdma 0000:80:16.4: irq 159 for MSI/MSI-X
[   19.174764] ioatdma 0000:80:16.5: irq 160 for MSI/MSI-X
[   19.176360] ioatdma 0000:80:16.6: irq 161 for MSI/MSI-X
[   19.177984] ioatdma 0000:80:16.7: irq 162 for MSI/MSI-X
[ 4519.415988] usb 8-1: USB disconnect, device number 2
~]#
3. Read and Clear dmesg logs
If you want to clear the kernel log buffer, then use the option -C in dmesg command,
~]# dmesg -C
or
~]# dmesg --clear
4. Display Colored Messages
Use ‘-L’ option in dmesg command if you want to print the colored messages in the output, example is shown below:
~]# dmesg -L
5. Limiting dmesg Output to Specific Log Facility
If you want to limit the dmesg output to specific log facility like daemon then use the option “–facility=daemon“.
~]# dmesg --facility=daemon
Output of above command would be something like below,
[    3.680902] systemd[1]: systemd 219 running in system mode. \
\  (+PAM +AUDIT +SELINUX +IMA -APPARMOR +SMACK +SYSVINIT +UTMP \
+LIBCRYPTSETUP +GCRYPT +GNUTLS +ACL +XZ -LZ4 -SECCOMP +BLKID +ELFUTILS +KMOD +IDN)
[    3.682017] systemd[1]: Detected architecture x86-64.
[    3.682022] systemd[1]: Running in initial RAM disk.
[    3.682060] systemd[1]: Set hostname to <controller01.egi.ericsson.com>.
[    3.734025] systemd[1]: Reached target Timers.
[    3.734041] systemd[1]: Starting Timers.
[    3.734219] systemd[1]: Created slice -.slice.
[    3.734231] systemd[1]: Starting -.slice.
[    3.736741] systemd[1]: Starting Apply Kernel Variables...
[    3.736792] systemd[1]: Listening on udev Kernel Socket.
[    3.736807] systemd[1]: Starting udev Kernel Socket.
[    3.736823] systemd[1]: Reached target Sockets.
[    3.736832] systemd[1]: Starting Sockets.
[    3.737418] systemd[1]: Starting Setup Virtual Console...
[    3.737488] systemd[1]: Started dracut ask for additional cmdline parameters.
[    3.738211] systemd[1]: Starting dracut cmdline hook...
[    3.738736] systemd[1]: Started Create list of required static \
device nodes for the current kernel.
[    3.740196] systemd[1]: Started Apply Kernel Variables.
[    3.743253] systemd[1]: Starting Create Static Device Nodes in /dev...
[    3.746693] systemd[1]: Started Create Static Device Nodes in /dev.
[    3.814248] systemd[1]: Started Setup Virtual Console.
[    3.822146] systemd[1]: Started Journal Service.
[   16.072365] systemd[1]: Inserted module 'ip_tables'
[root@controller01 ~]#
Following are the supported log facilities in dmesg command,
- kern
- user
- daemon
- auth
- syslog
- lpr
- news
6. Restrict dmesg Output to Specific List of Levels
The kernel log messages are categorized into different log levels, such as
- emerg
- alert
- crit
- err
- warn
- notice
- info
- debug
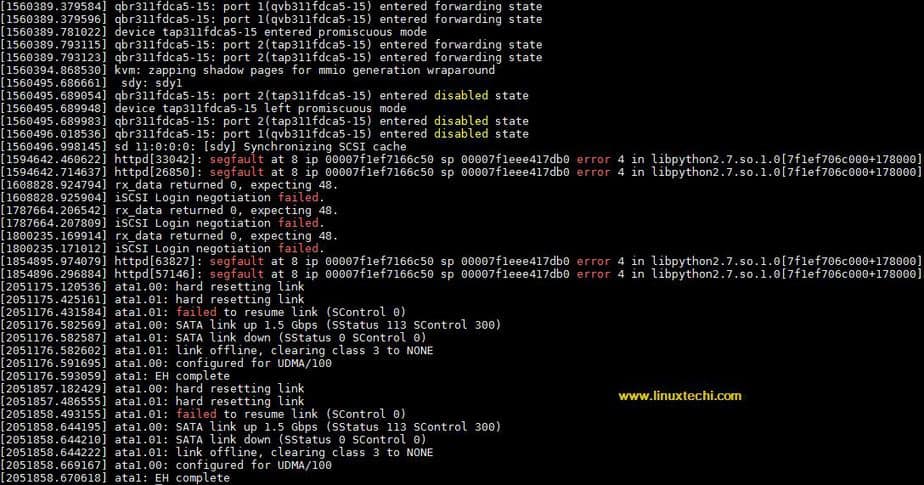
Let’s assume we want to display logs related to error and warning, then use “–level” option followed by levels like err & warn, example is shown below
~]# dmesg --level=err,warn
----------------------------------
[1341929.334323] iSCSI Login negotiation failed.
[1491798.215987] rx_data returned 0, expecting 48.
[1491798.217027] iSCSI Login negotiation failed.
[1494278.360062] rx_data returned 0, expecting 48.
[1494278.361265] iSCSI Login negotiation failed.
[1557620.564093] blk_update_request: critical target error, dev dm-6, \
sector 2153
[1557620.565432] dm-23: WRITE SAME failed. Manually zeroing.
[1558518.963985] Unable to load target_core_user
[1559841.691841] TARGET_CORE[iSCSI]: Expected Transfer Length: \
264 does not match SCSI CDB Length: 8 for SAM Opcode: 0x12
[1559841.691953] scsi 10:0:0:0: alua: not attached
[1559860.013693] kvm [72955]: vcpu0 unhandled rdmsr: 0x1ad
[1560386.614083] TARGET_CORE[iSCSI]: Expected Transfer Length: \
264 does not match SCSI CDB Length: 8 for SAM Opcode: 0x12
[1560386.614172] scsi 11:0:0:0: alua: not attached
[1608828.924794] rx_data returned 0, expecting 48.
[1608828.925904] iSCSI Login negotiation failed.
[1787664.206542] rx_data returned 0, expecting 48.
[1787664.207809] iSCSI Login negotiation failed.
[1800235.169914] rx_data returned 0, expecting 48.
[1800235.171012] iSCSI Login negotiation failed.
[2051176.431584] ata1.01: failed to resume link (SControl 0)
[2051858.493155] ata1.01: failed to resume link (SControl 0)
………………………………………………………………………………
#
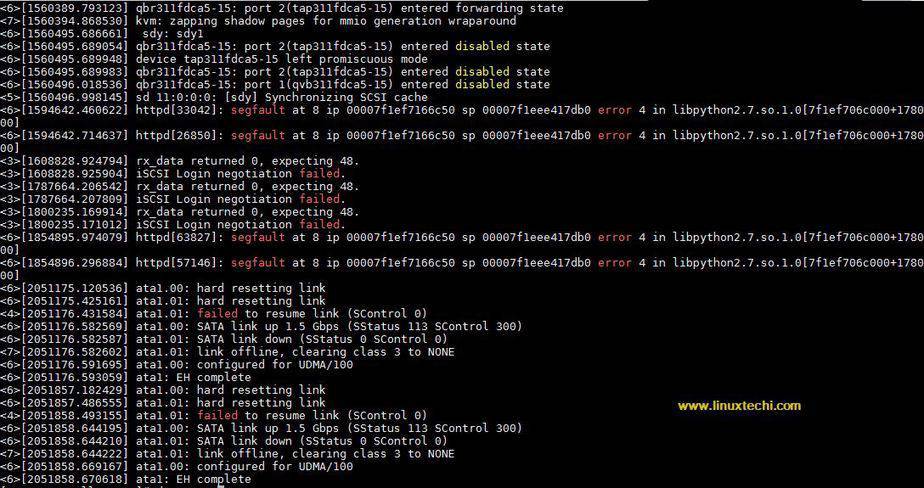
7. Timestamps in dmesg Output
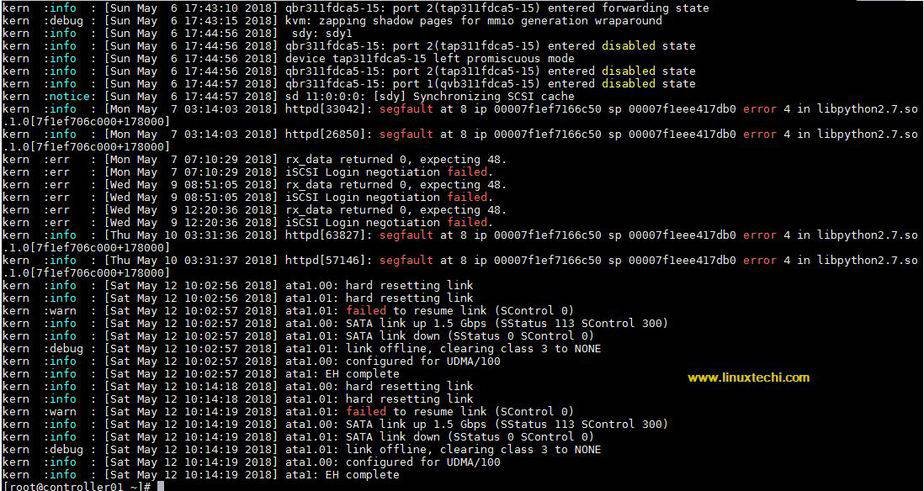
By default, dmesg displays messages with relative timestamps. If you prefer to see absolute timestamps, use the “-T” option:
~]# dmesg -T
……………………………………………
Wed May  9 12:20:36 2018] rx_data returned 0, expecting 48.
[Wed May  9 12:20:36 2018] iSCSI Login negotiation failed.
[Thu May 10 03:31:36 2018] httpd[63827]: segfault at 8 ip \
 00007f1ef7166c50 sp 00007f1eee417db0 error 4 in \
libpython2.7.so.1.0[7f1ef706c000+178000]
[Thu May 10 03:31:37 2018] httpd[57146]: segfault at 8 ip \
00007f1ef7166c50 sp 00007f1eee417db0 error 4 in \
libpython2.7.so.1.0[7f1ef706c000+178000]
[Sat May 12 10:02:56 2018] ata1.00: hard resetting link
[Sat May 12 10:02:56 2018] ata1.01: hard resetting link
[Sat May 12 10:02:57 2018] ata1.01: failed to resume link (SControl 0)
[Sat May 12 10:02:57 2018] ata1.00: SATA link up 1.5 Gbps \
(SStatus 113 SControl 300)
[Sat May 12 10:02:57 2018] ata1.01: SATA link down (SStatus 0 SControl 0)
[Sat May 12 10:02:57 2018] ata1.01: link offline, clearing class 3 to NONE
[Sat May 12 10:02:57 2018] ata1.00: configured for UDMA/100
[Sat May 12 10:02:57 2018] ata1: EH complete
[Sat May 12 10:14:18 2018] ata1.00: hard resetting link
[Sat May 12 10:14:18 2018] ata1.01: hard resetting link
[Sat May 12 10:14:19 2018] ata1.01: failed to resume link (SControl 0)
[Sat May 12 10:14:19 2018] ata1.00: SATA link up 1.5 Gbps \
(SStatus 113 SControl 300)
[Sat May 12 10:14:19 2018] ata1.01: SATA link down (SStatus 0 SControl 0)
[Sat May 12 10:14:19 2018] ata1.01: link offline, clearing class 3 to NONE
[Sat May 12 10:14:19 2018] ata1.00: configured for UDMA/100
[Sat May 12 10:14:19 2018] ata1: EH complete
…………………………………………………
In case, if you want timestmaps along with decode facility and levels in dmesg command output then use “-Tx” option,
~]# dmesg -Tx
8. Monitoring Real-time Kernel Messages
If you want to continuously monitor the kernel messages in real-time, use the “-w” or “–follow” option:
~]# dmesg --follow
or
~]# dmesg -w
In case, you want to enable timestamps along real time monitoring of dmesg then use the following command,
~]# dmesg -Tx --follow
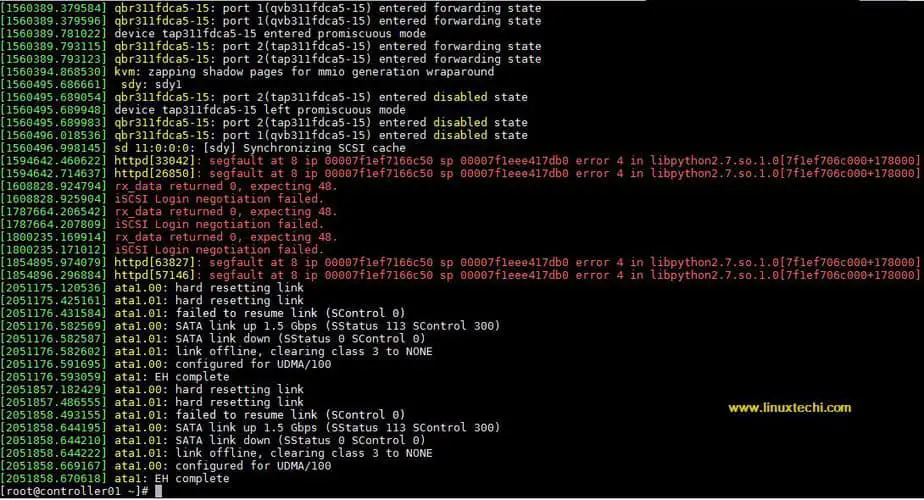
9. Display raw message buffer using ‘-r’ option
Use ‘-r’ option in dmesg command to display raw message buffer, example is shown below,
~]# dmesg -r
10. Force dmesg Command to Use Syslog
There can be some situations where we want dmesg to get its data from syslog rather than /dev/kmsg. This can be easily achieved using the option “-S“, example is shown below:
~]# dmesg -S
dmesg command logs are stored in the file “/var/log/dmesg”
Conclusion:
The dmesg command serves as a window into the kernel’s message buffer, providing invaluable insights into system events, hardware initialization, and driver-related issues. Armed with the knowledge gained from this comprehensive guide, you are now equipped to harness the power of the dmesg command in Linux. Whether it’s troubleshooting hardware problems, monitoring network events, or debugging driver issues, dmesg will undoubtedly prove to be an indispensable tool in your Linux system administration arsenal.
Read Also : 20 ps Command Examples to Monitor Linux Processes