The Top utility tool is a handy tool that gives Linux users a peek at the performance statistics on their systems. You can use it to monitor resource metrics such as memory usage, CPU, load average, uptime and processes that are running on the system.
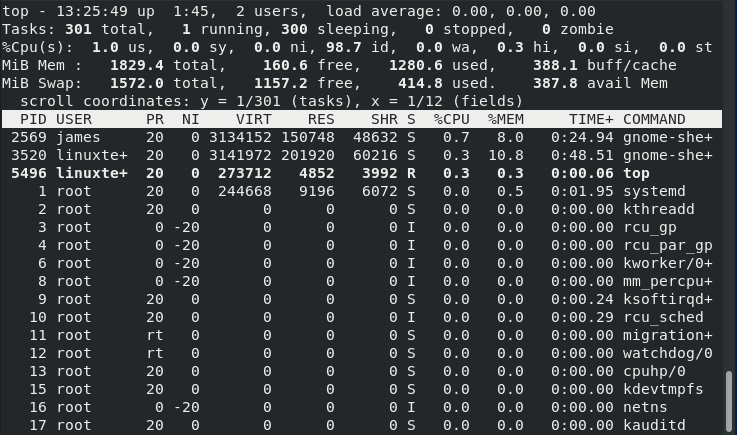
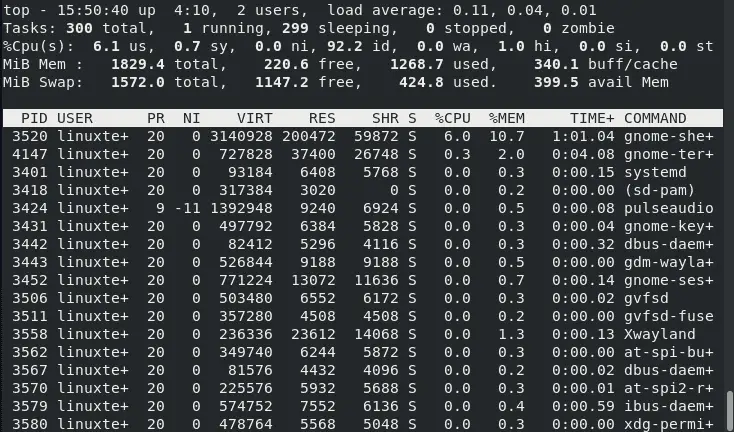
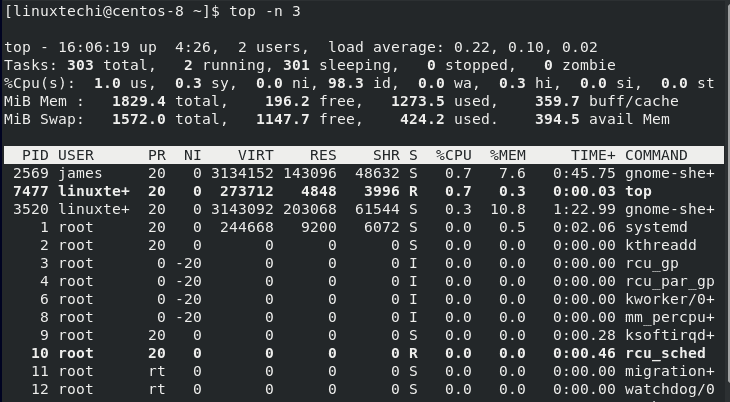
Top utility tool gives the user an overview of the system’s crucial performance statistics. The image below is a screenshot of the terminal showing the system’s statistics such as users logged in, tasks, uptime, CPU utilization, memory utilization and swap usage.
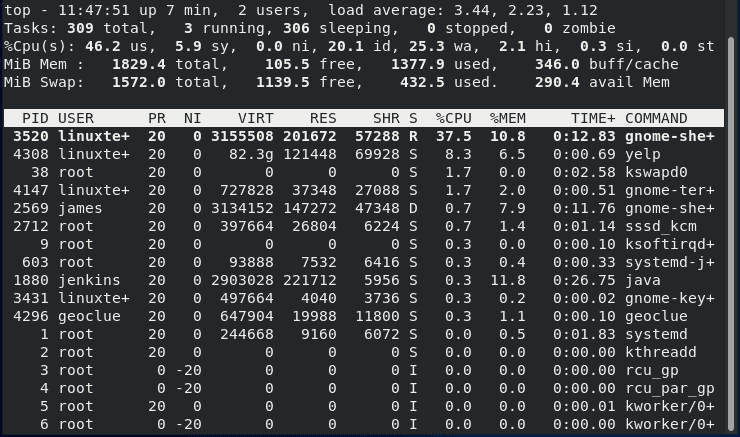
Every column above represents different information as the horizontal lines indicate a summary of the different areas running in the system. Let us analyze some of the columns for better understanding.
PID – This stands for Process ID. Every running process on the Linux systems bears a PID
USER – This is the user running the process or use that the process is running under.
PR – Indicates process priority from the Linux Kernel
NI – represents the nice value that matches the user space. The value ranges from -20 as the highest figure, 0 the default, and +19 as the lowest. There is a relationship between nice value and priority which is PR = 20 + NI
VIRT – represents the amount of virtual memory the process is using. It also describes the virtual size of a process.
RES – Defines the resident memory capacity.
SHR – This refers to shared memory that a process is assigned. It also indicates how much of the VIRT is available for sharing in terms of libraries or memory.
- S – Represents the status of a particular process that has the following values:
- D – A process waiting for something to happen
- R – Ready to run the process
- S – Process sleep state waiting for a trigger
- T – Indicates a traced or stopped process
- Z – Indicates a dead process (Zombie process) or one that has completed execution
%CPU – time the task has been using since the last update. On machines with more than CPU, the percentage can be more than 100%
%MEM – a percentage of the available physical memory a process is using
TIME+ – Represents the total time a task is utilizing since it was started
COMMAND – Represents the actual process or command currently running
Other output on the command line following the top command may not be visible on the first page. They include:
- Uptime and load average
- CPU states
- Tasks
- Memory usage
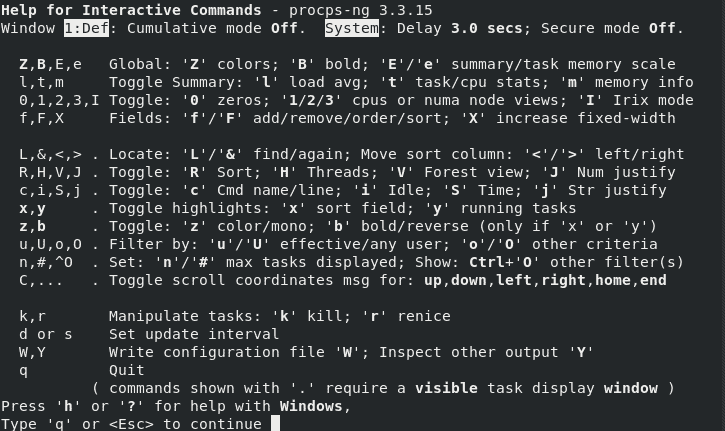
1) Using Top Help Menu
The interactive nature of the help menu gives options on the number of commands administrators use. To get help using the top utility, simply type h or the question mark symbol ?
2) Manual Display Refresh
By default, the top command displays information on a 3 seconds interval. To get the manual refresh mode use the ENTER or SPACE keys.
3) Changing Display Mode
Instead of using a single-window to analyze your system, you can set the output to display four windows each with a different field or group using the names:
- Mem : sort by %MEM
- Def : Sort by %CPU
- Job : sort by PID
- Usr : Sort by User field
The Alternative Display Mode is achieved by pressing A, giving each field a unique summary.
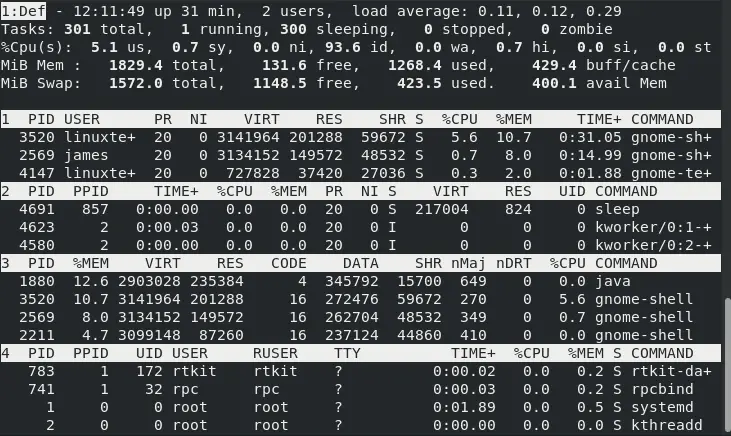
Toggling between windows is possible through a (next) and w (previous) keys. Additionally, you can press g and enter between 1 to 4 to toggle between the windows.
4) Display in Bold
The use of letter B changes the output to bold. When the B is ON and is in monochrome mode, the whole screen will appear as normal unless the x and y are on reverse mode giving no visual display
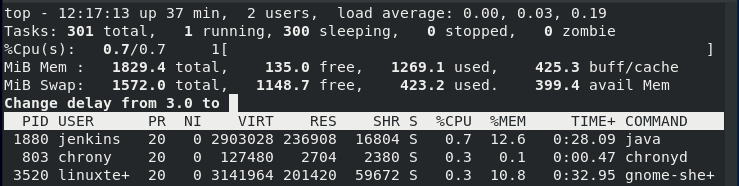
5) Set the Time Interval
Use the d or the s keys to change the output delay time frame. When you enter either d or s, you will get a prompt to enter a value, which the display will pick as its interval in seconds
6) Shifting Load, Memory, and Task info
The keys m, t, l toggles the memory info, task or CPU status, and load average, respectively.
7) Display Field Management
Use F to choose the field you want to use on the screen. To select a field, press the SPACE or the d keys until you see the fields with an Asterix (*) are selected. Once you are done, quit using the q or ESC key.
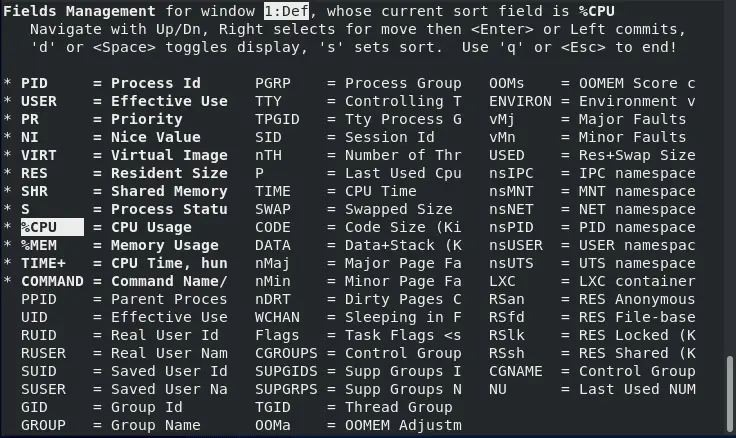
Manipulating the above output use, the < or > keys to manipulate the above output either to the left or to the right.
8) Reverse Sorting
The default order of sorting takes place in descending order. Use R to reverse the order. The use of this interaction highlights processes that consume the least amount of CPU at the top.
9) Show the full path of command
You will use C to get the full path alongside the command line arguments in its column as shown
10) Idle Tasks
The i key displays all the active tasks. When it is off no task that has not been used will be displayed. However, when %CPU and TIME+ fields come into focus, some processes may show but with no CPU allocated time or usage.
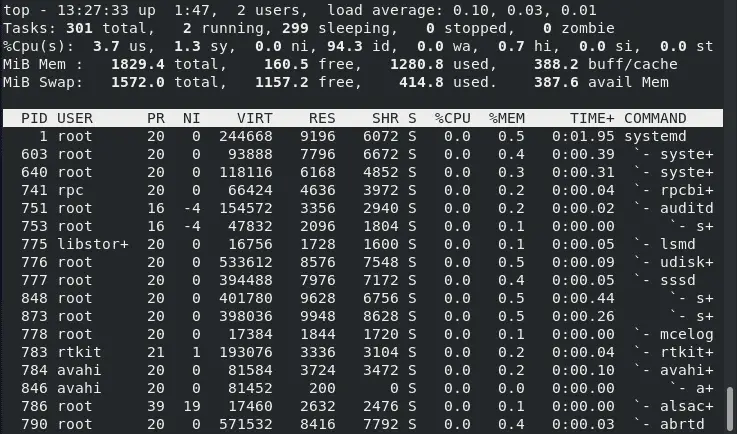
11) Forest View
Use the V key to display processes in a hierarchical manner
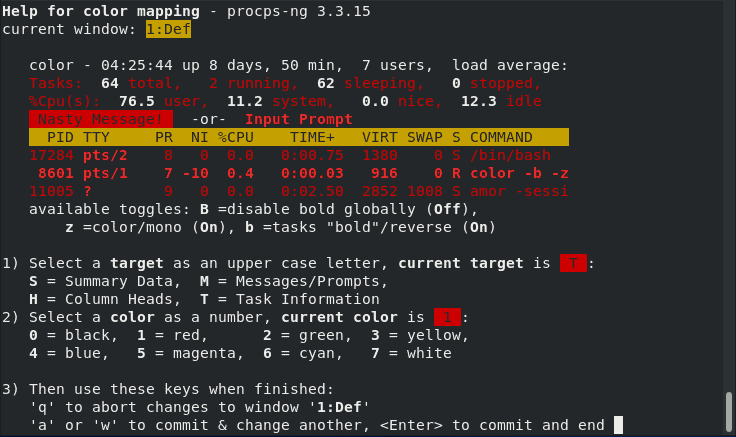
12) Changing Color Map
Press the Z key to get a screen that allows you to change colors. Z brings another screen that manipulates the color of the present window or all four windows. You will see four uppercase letters that give an option of selecting eight numbers to get the color you want.
13) Toggle Color
To turn on /off the screen output, use z to switch the active window to the last color scheme. The command alters the summary and the task area.
14) Change the Highlight of the Sort Field and Active Tasks
Hit the x key for the columns toggle changes. A particular sort field may not be visible due to insufficient screen size, and at the same time, the iterative f command is off.
15) Show User Specific Processes
Pressing the letter u will prompt for a user and later display the processes associated with the user.
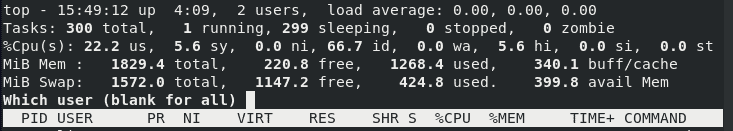
The output below lists processes by the user linuxtechi
16) The Number of Tasks Displayed
Use n or # prompts you to enter the maximum number of tasks to be displayed.
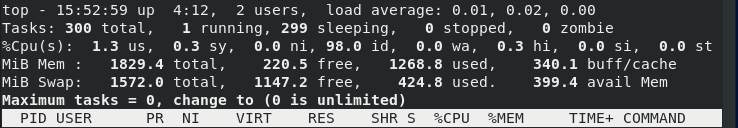
The screen output below shows the number of tasks (10) to display.
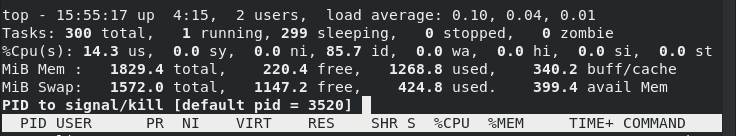
17) Kill Tasks
To kill a task, simply hit the k key on the keyboard. This prompts for the PID of the process you wish to end. If no PID is provided, the default signal will be ended.
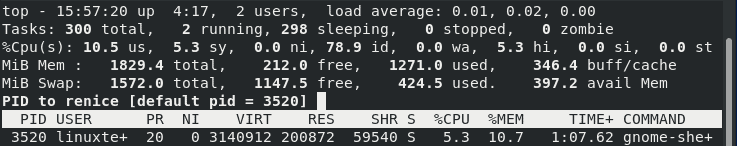
18) Renice Task
Administrators use the r option to change process priority and may reschedule its priority. When using r, you will get a prompt for the PID and a value to nice it. A negative number or no PID entry defaults to the first task on the output. Enter a 0 if you want to renice the top command, while at the same time keying in a positive PID leads to loss of priority, and a negative one will gain favor in the kernel.
The default case of renicing allows the user to increase but not lower the nice value. Abort any of the renice processes using:
- At the PID prompt, specify an invalid number
- At the nice prompt key in ENTER
- At any prompt, use ESC key
19) Separate CPU States
To issue the above command, you must know that keying in t affects how the CPU state appears. You will note the %CPU in the summary area.
20) Summarize the CPU State
Use the number 2 as the command to toggle between CPU summary display (obtained by 1) or the summary in addition to statistics for each node.
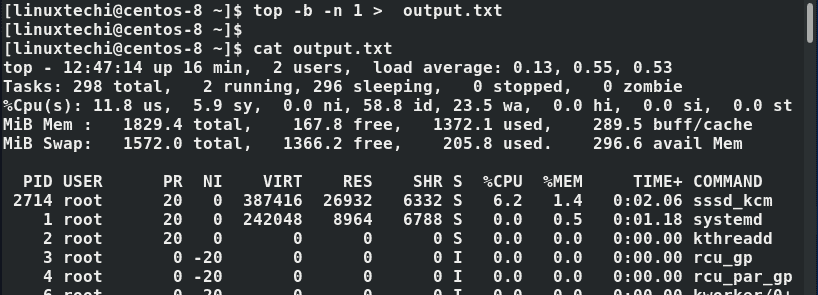
21) Use top command to send output to another file
If you wish to save the output of top command onto another file, use the -b option.
$ top -b -n 1 > output.txt$ cat output.txt
22) Idle Process Toggle in Command Line
The i option sets the top command with its last state
23) Set the Number of Iterations in Command Line
Use the -n option to set the number of iterations the top command goes through before it exits
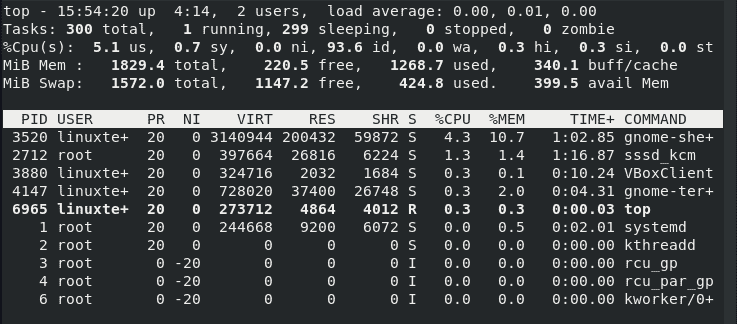
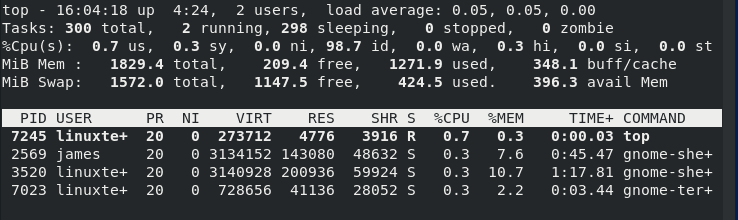
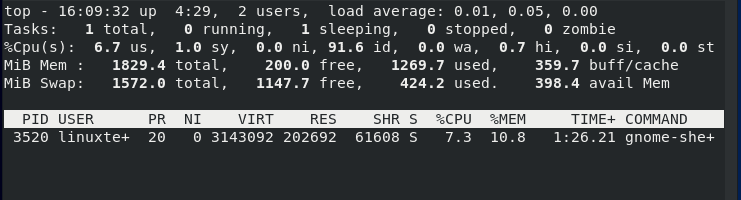
24) Monitor Specific PIDs
As an Administrator, you may want to follow a particular PID using the -p option. A value of 0 focuses on the command (top) itself.
Use the following syntax
$ top -p pid_value
For example,
$ top -p 3520
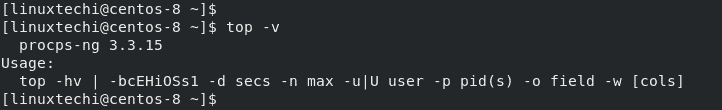
25) Check the Version of Top Command
System Administrators can use -v option to view top command version
Conclusion
As you have seen, using the top utility to monitor your systems’ performance is quite easy. The tool gives you a glance of what’s happening on your system and can be an excellent tool for troubleshooting purposes especially when your system slows down due to a process hogging the system’s resources.
Also Read : How to Use htop to Monitor Linux System Processes