As a Linux user, understanding and managing processes is essential for optimizing system performance and troubleshooting potential issues. While the built-in top command provides a basic overview of running processes, htop takes process monitoring to the next level with its user-friendly interface and powerful features.
In this guide, we look at how you can make the most of the htop command utility to retrieve various system metrics. Htop works across all Linux distributions.
Installing htop
Before diving into the features of htop, ensure that it is installed on your Linux system. On most popular distributions like Ubuntu, Debian, RHEL, Rocky Linux, AlmaLinux & Fedora, you can install htop using the package manager:
For Debian / Ubuntu
$ sudo apt update
$ sudo apt install htop -y
For RHEL / Fedora / Rocky Linux / AlmaLinux
$ sudo yum install epel-release
$ sudo yum install htop -y
To fire up htop and display system metrics, simply type the command htop.
# htop
Sections of htop command
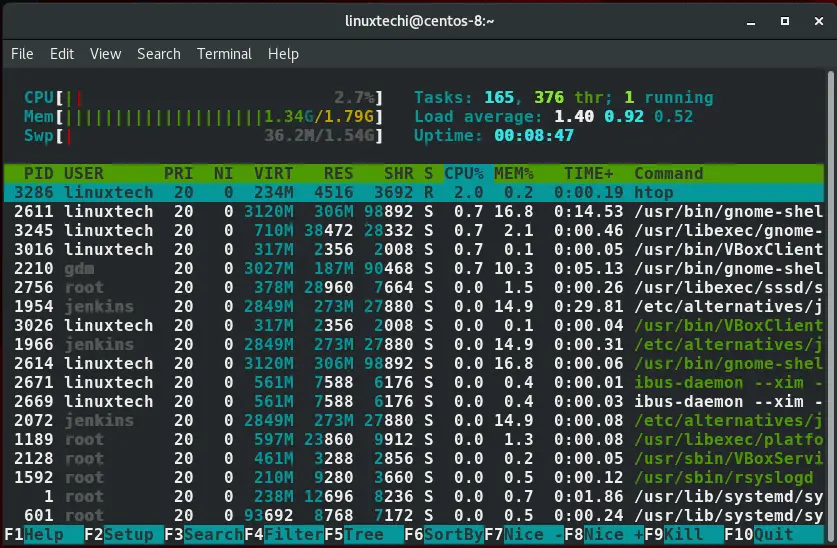
From the output see earlier on, we can clearly see that htop’s display is categorized into 3 sections:
Header Section:
The header section displays system metrics which include CPU, Memory and Swap utilization, running tasks, load average, and uptime.

Body:
This section lists all the running processes.
Footer Section:
This displays’ htop menu options
![]()
Some of the advantages of using htop over top command include:
- Ability to use the mouse to interact with htop utility.
- System metrics are color-coded to make it easier to identify at a glance.
- Htop provides a way of killing a process without invoking its PID.
- You can scroll up and down using the mouse or Arrow up & arrow down keys to have a view of all the running processes.
Using htop command
Let’s now shift gears and see the various options that come with the htop utility tool.
Sorting output
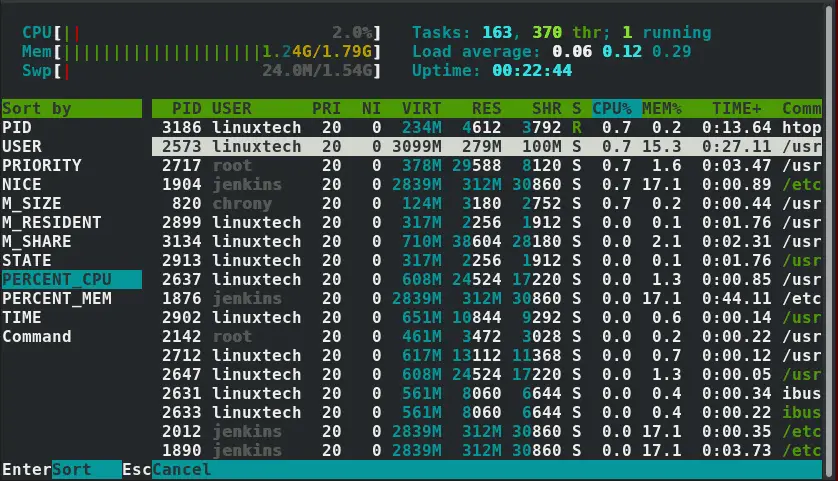
Htop provides multiple options that you can use to sort your output. To view the output options, simply hit the F6 function key on your keyboard. On the left section, scroll and select the criteria that you want to use when sorting the output. By default, this is set to the PERCENT_CPU option.
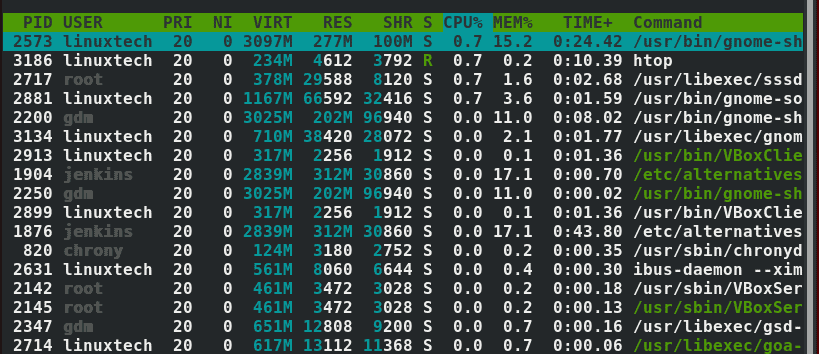
To sort using Memory Percent utilization, use the down-arrow key and hit ENTER on the PERCENT_MEM option.
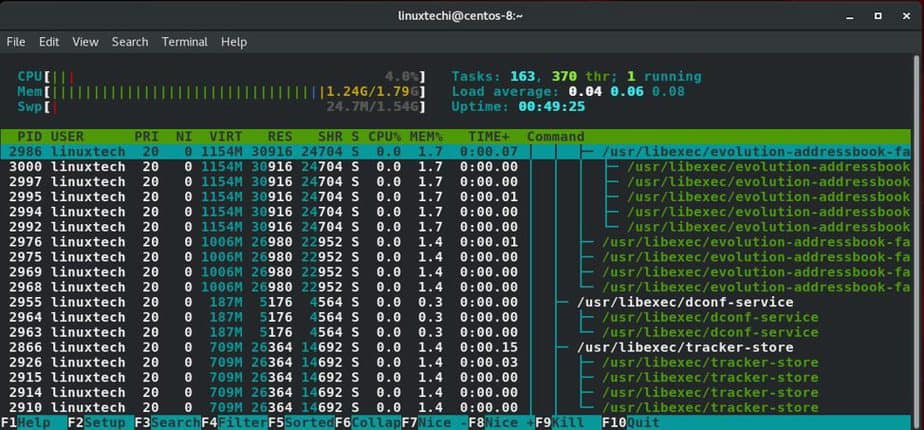
List processes in a tree-like format
Linux processes are usually in a hierarchical order, creating a child-parent relationship. To display the relationship, simply press the F5 function key.
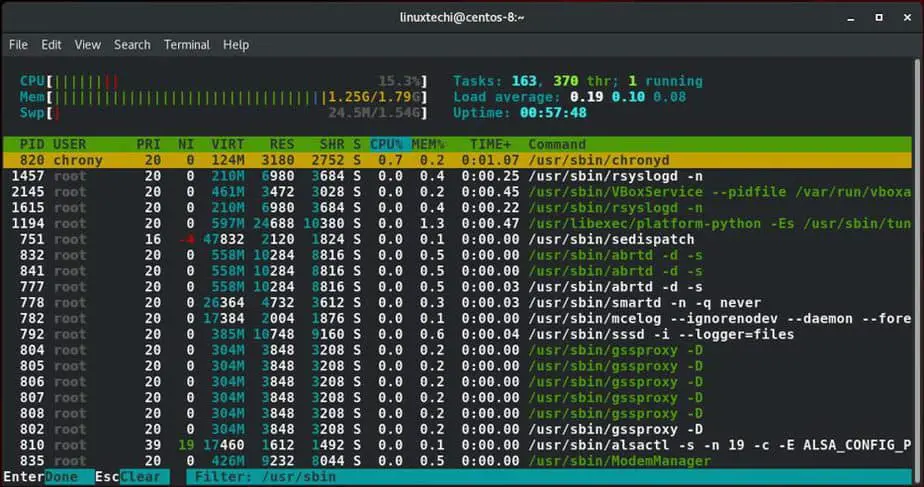
Filtering Processes
Linux processes can also be filtered according to their respective paths. To filter processes, press the F4 function key. You will be prompted to enter the path of the process at the footer section. In the output below, I have displayed the processes in the /usr/sbin path.
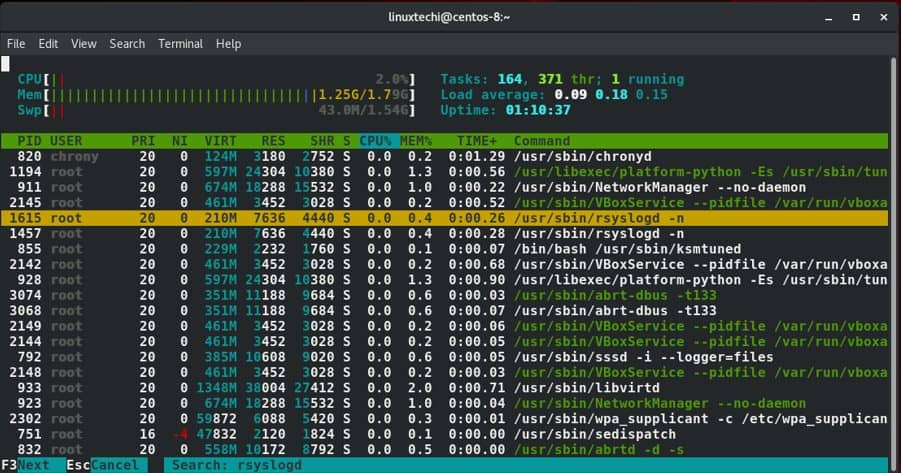
Searching Processes
You can also search for a process by simply pressing the F3 key and typing the name of the process in the search prompt that appears at the bottom of the terminal screen.
For instance, in this case, I’m searching for the rsyslogd process in the /usr/sbin path. Once located, the process will be highlighted in yellow.
Killing a process
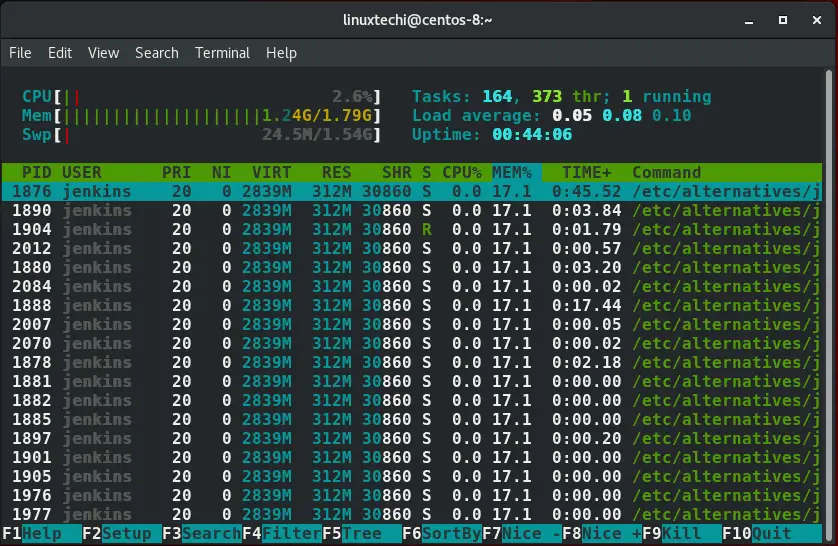
After launching htop, simply scroll to the process you want to terminate or ‘kill’. In this case, I have selected Jenkins with a PID of 1983.
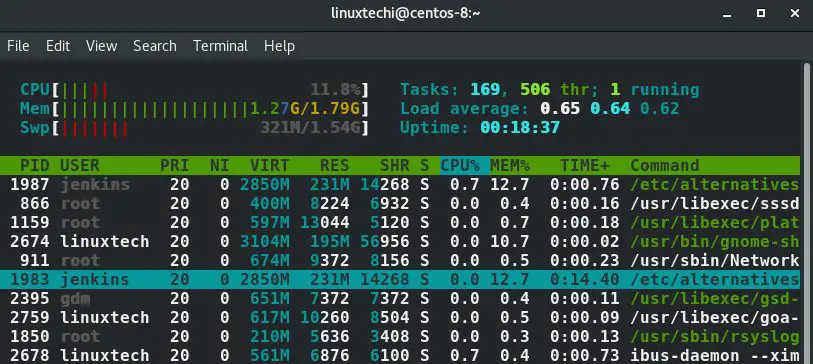
Next, press the F9 functional key or the letter k and select the signal that you want to send. In this case, I have selected SIGKILL to ensure the process quits.
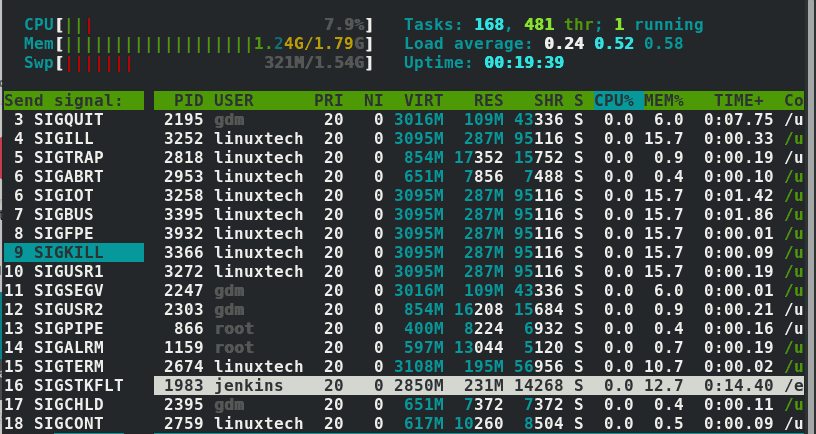
Then finally press ENTER.
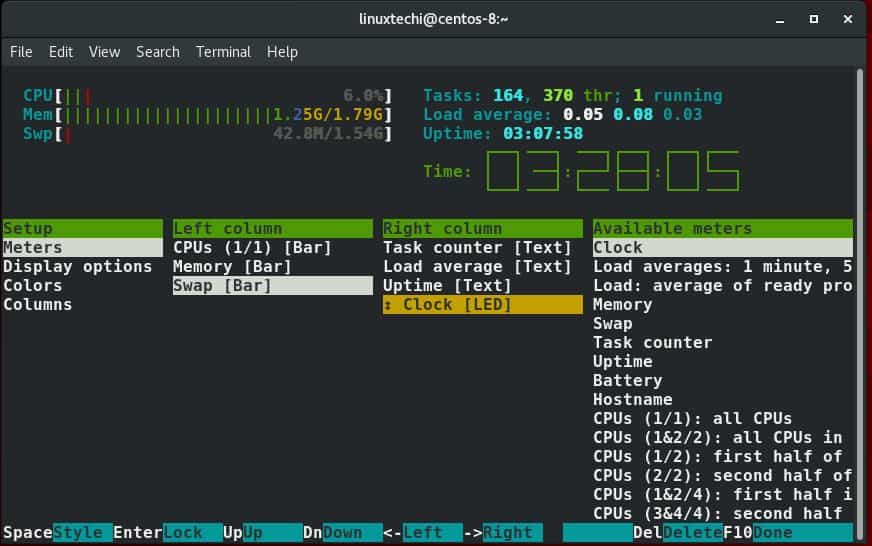
How to customize htop output
To make a few tweaks here and there that will determine how your output looks like, hit the F2 key. Several options will be available to change for instance colors, font style of system metrics to mention a few.
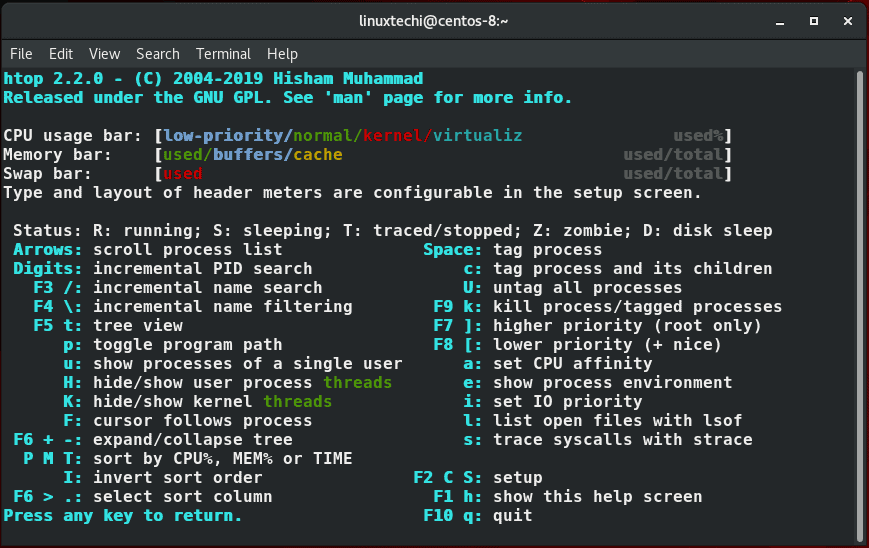
Getting help
To get assistance on how to find your way with htop and best leverage the various shortcuts therein, simply hit the F1 key. A list of key options and what they do will be displayed as shown.
Conclusion
htop is a powerful and user-friendly process monitoring tool that provides real-time insights into your Linux system’s performance. By understanding how to use htop effectively, you can optimize resource utilization, identify problematic processes, and maintain the stability and responsiveness of your system. Whether you’re a system administrator, developer, or a Linux enthusiast, htop is a must-have tool in your arsenal for managing processes efficiently. So go ahead, install htop, and unleash the full potential of process monitoring on your Linux machine.